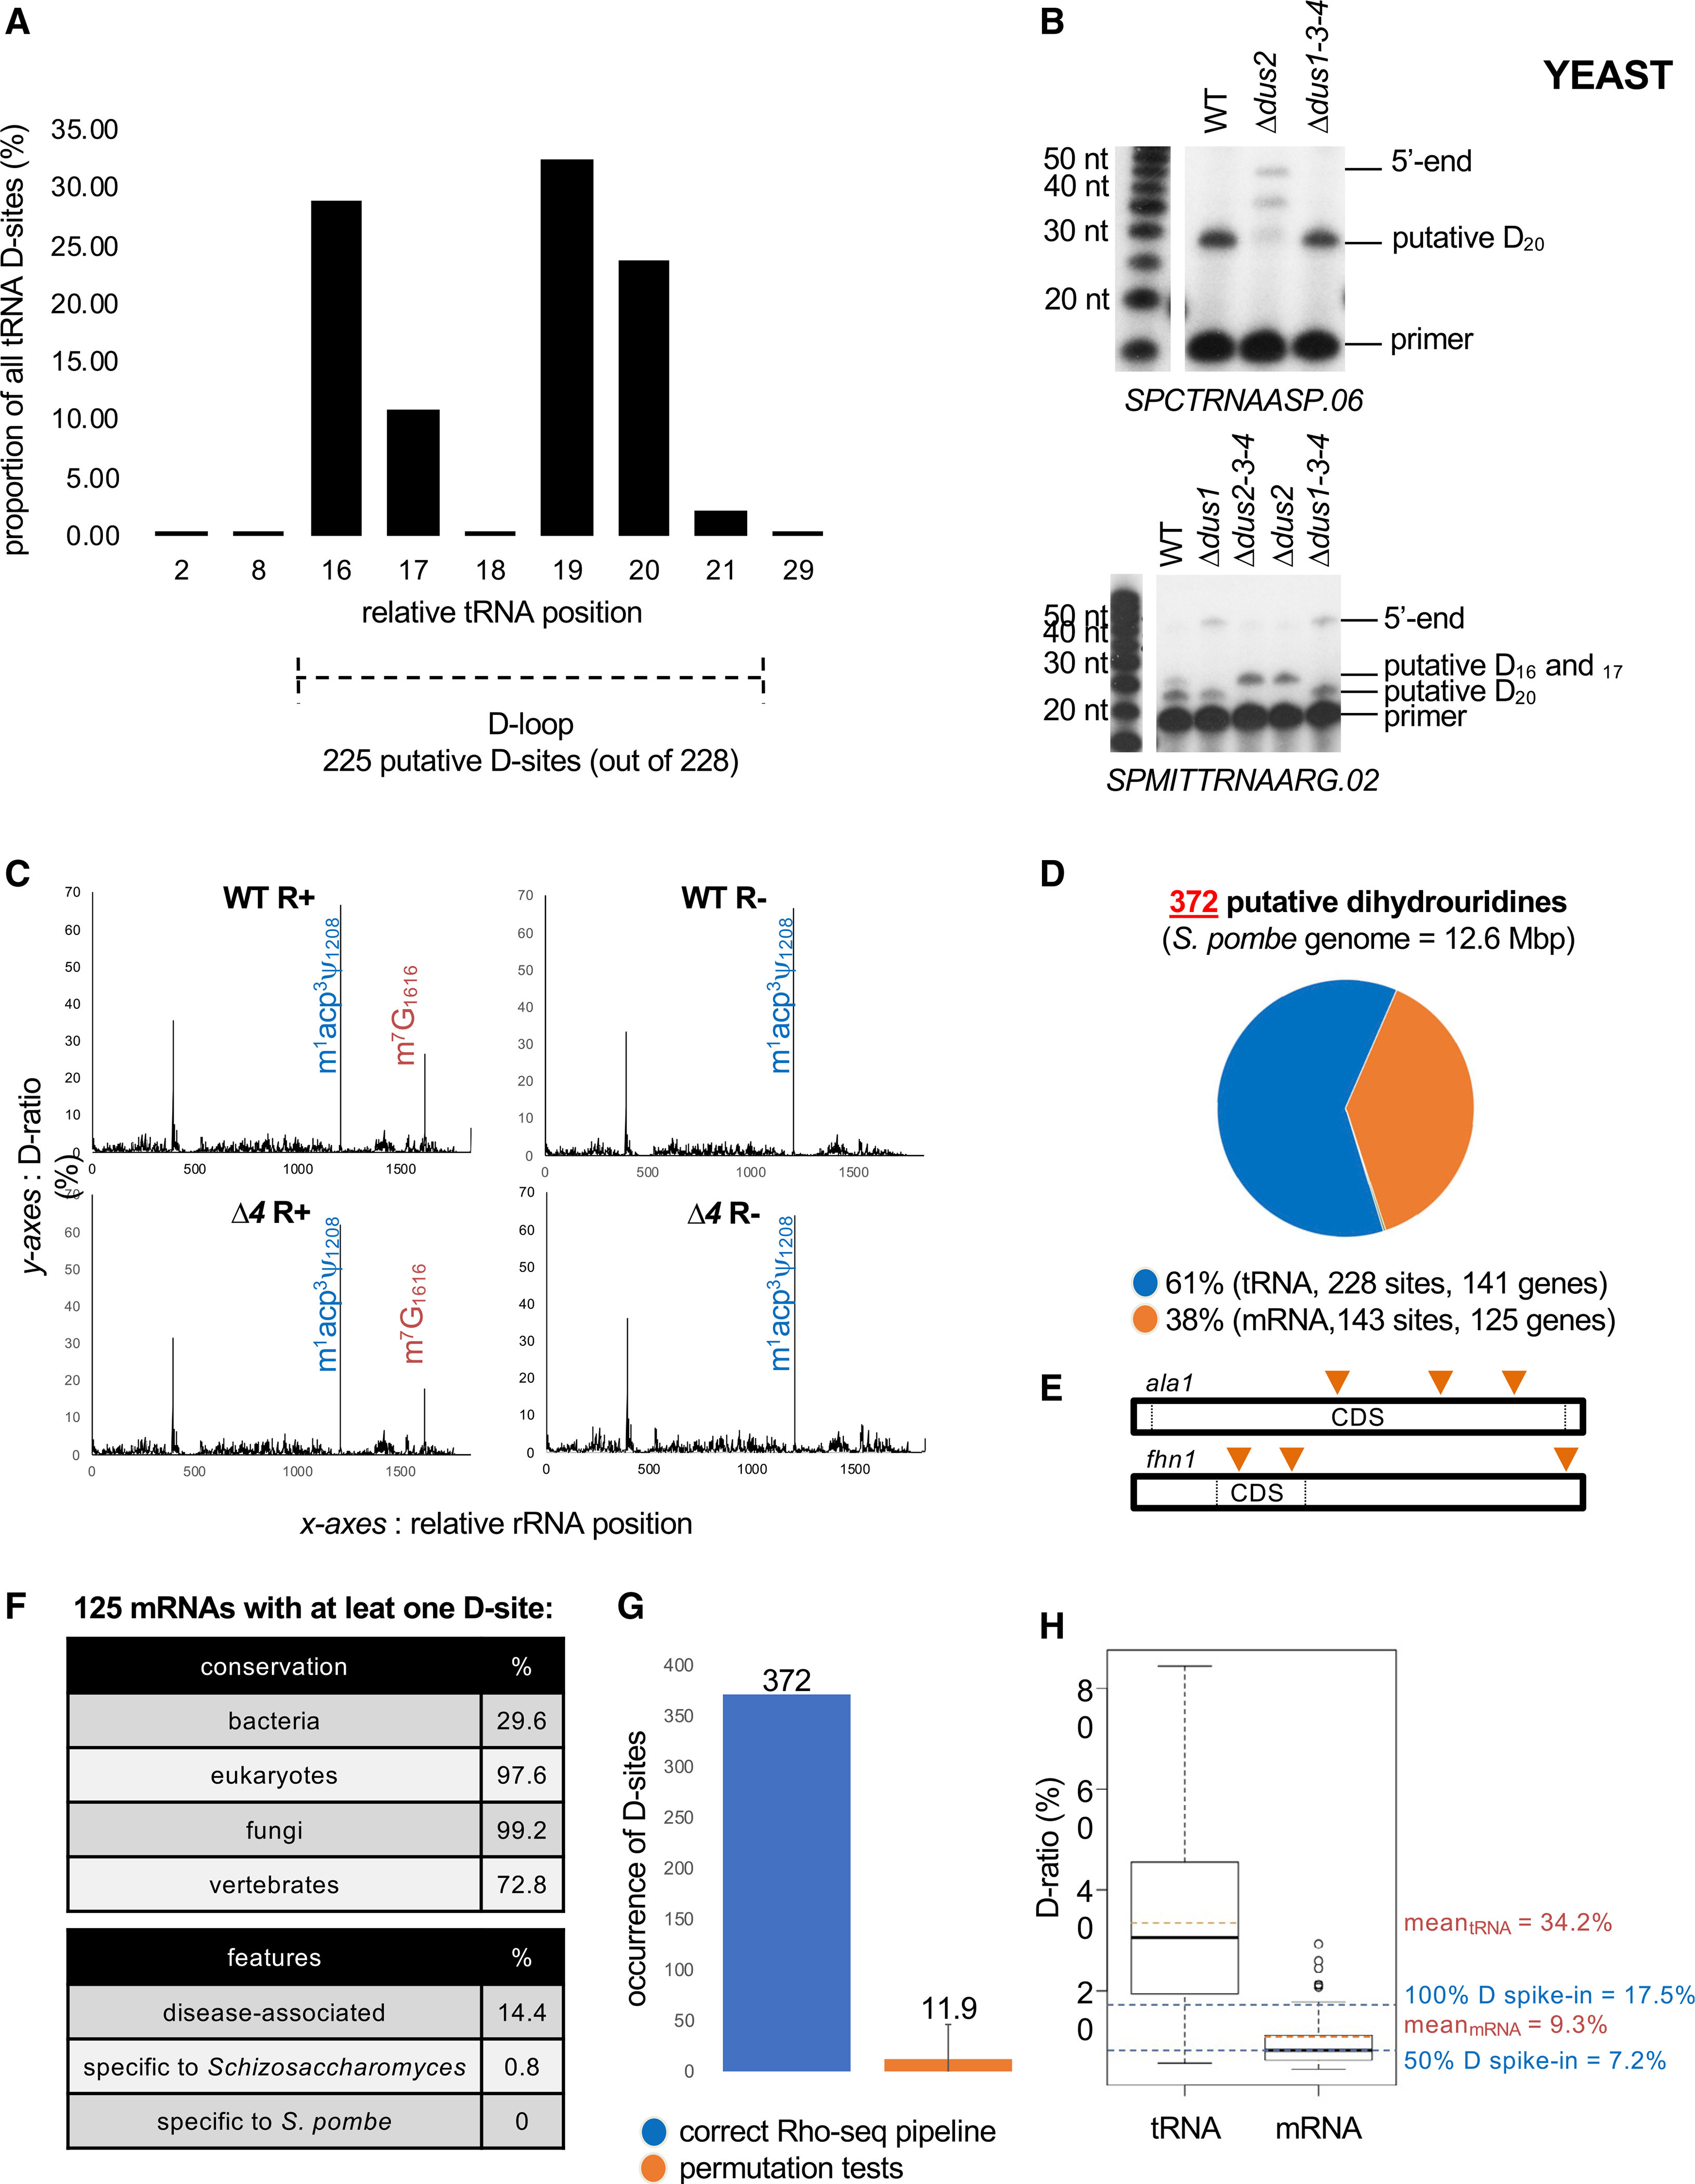
Figure 2. Rho-seq detects D on yeast tRNAs.

(A) Distribution of the 228 tRNA D-sites according to their relative position on tRNA.
(B) Upper panel: primer extension assays specific to tRNAAspGUC (containing a putative Dus2-dependent D20 based on Rho-seq) performed on R+ total RNA from WT, single dus (Δdus2), and triple dus (Δdus1–3-4) mutant strains. Bottom panel: primer extension assays specific to tRNAArgUCG (putative Dus1-dependent D16–17 and putative Dus2-dependent D20 based on Rho-seq) performed on R+ total RNA from WT, single dus (Δdus1, Δdus2), and triple dus (Δdus1–3-4, Δdus2–3-4) mutant strains.
(C) D-ratio profiles along the entire 18S rRNA in R+ and R− conditions in WT or Δd4 strains. The m1acp3y modification (blue) naturally blocks a RT reaction. The m7G modification (orange) is sensitive to R labeling and therefore blocks the RTase in R+ conditions independently of the strain. Representative example for SPRRNA.43 is shown.
(D) Distribution of 372 detected D-sites in fission yeast within tRNAs and mRNAs.
(E) Putatively dihydrouridylated mRNAs have up to three distinct D-sites on their sequence. ala1 and fhn1 are the two mRNAs dihydrouridylated at three different positions (orange triangles).
(F) General features of the 125 protein-coding genes whose RNA products are modified.
(G) Effect of the assignment of test and control conditions in the Rho-seq analysis pipeline. Sixteen permutation tests were performed in which the properly committed information was randomly mixed. Error bars represent max and min numbers of detected D-sites upon permutation.
(H) Boxplot representation of WT R+ D-ratio distribution for tRNAs (228 values) and mRNAs (143 values) and corresponding means highlighted by orange dashed lines. Blue dashed lines indicate the D-ratios of R+ 100% D spike-in and 50% D spike-in.
