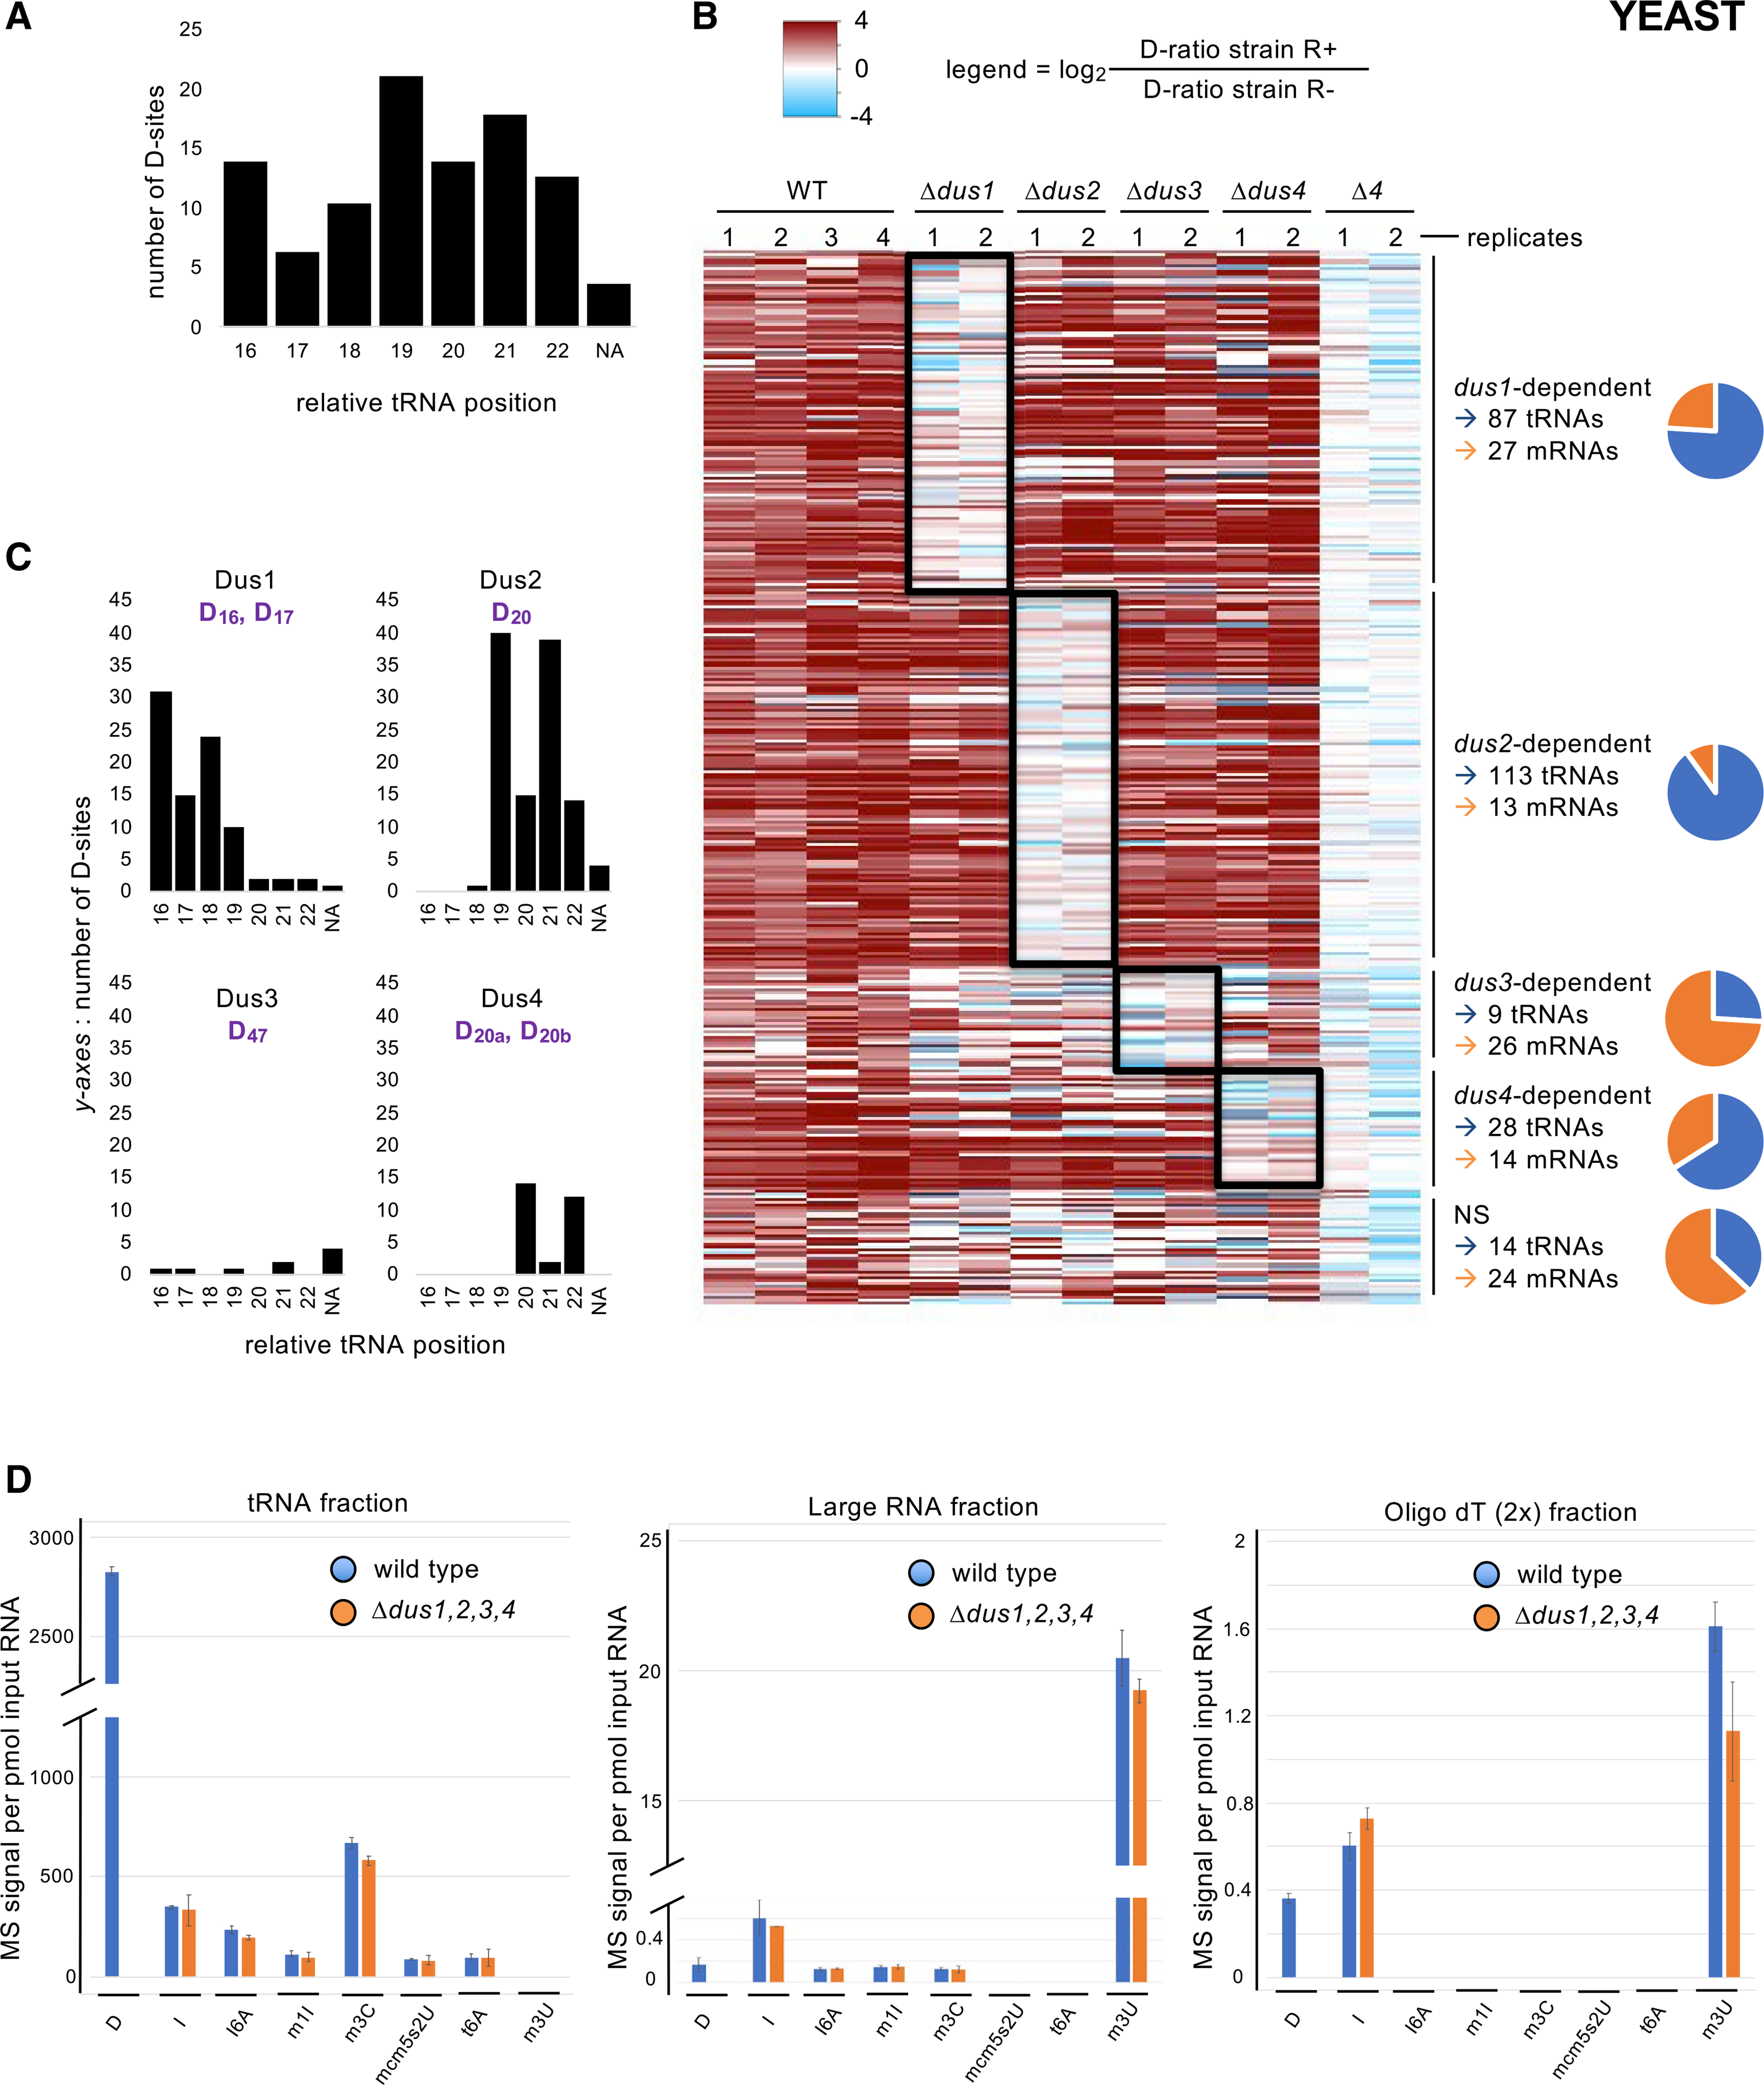
Figure 3. Fission yeast protein-coding genes products are dihydrouridinated.

(A) Distribution of the 251 tRNA D-sites according to their relative position on tRNA. NA, not assigned (for positions that were out of the D-loop).
(B) Heatmap showing all detected D-sites sorted by comparison of their respective D-ratios in test (R+) and control (R−) conditions. Dark red hue highlights more RT terminations in the test condition (D-ratio R+ > D-ratio R−). The columns depict all replicates from the indicated strains. All sites were clustered according to their dus1, dus2, dus3, or dus4 dependency, as shown to the right of the map. If no dependency was revealed by the statistical analysis, the sites were clustered in the NS (non-significant) category. The ratio of tRNA (blue) and mRNA (orange) is shown on the graphic. A total of 237 tRNA and 80 mRNA D-sites show Dus specificity.
(C) Distribution of the 87 Dus1-dependent, 113 Dus2-dependent, 9 Dus3-dependent, and 28 Dus4-dependent tRNA D-sites according to their relative position on tRNA. NA, not assigned (for positions that were out of the D-loop). The expected target sites are shown in purple.
(D) LC-MS/MS analyses of the D content of several classes of RNA. Left panel: a tRNA-enriched fraction was isolated from the indicated strains by size-exclusion chromatography (SEC), hydrolysed into single ribonucleosides, and analyzed by LC-MS. Middle panel: a corresponding “large RNA” fraction from the same SEC was similarly analyzed. Right panel: an mRNA-enriched fraction from the indicated strains was obtained by two poly-T affinity purifications in tandem and analyzed as above. Each column represents the averaged value ± SEM (n = 3 biological replicates).
