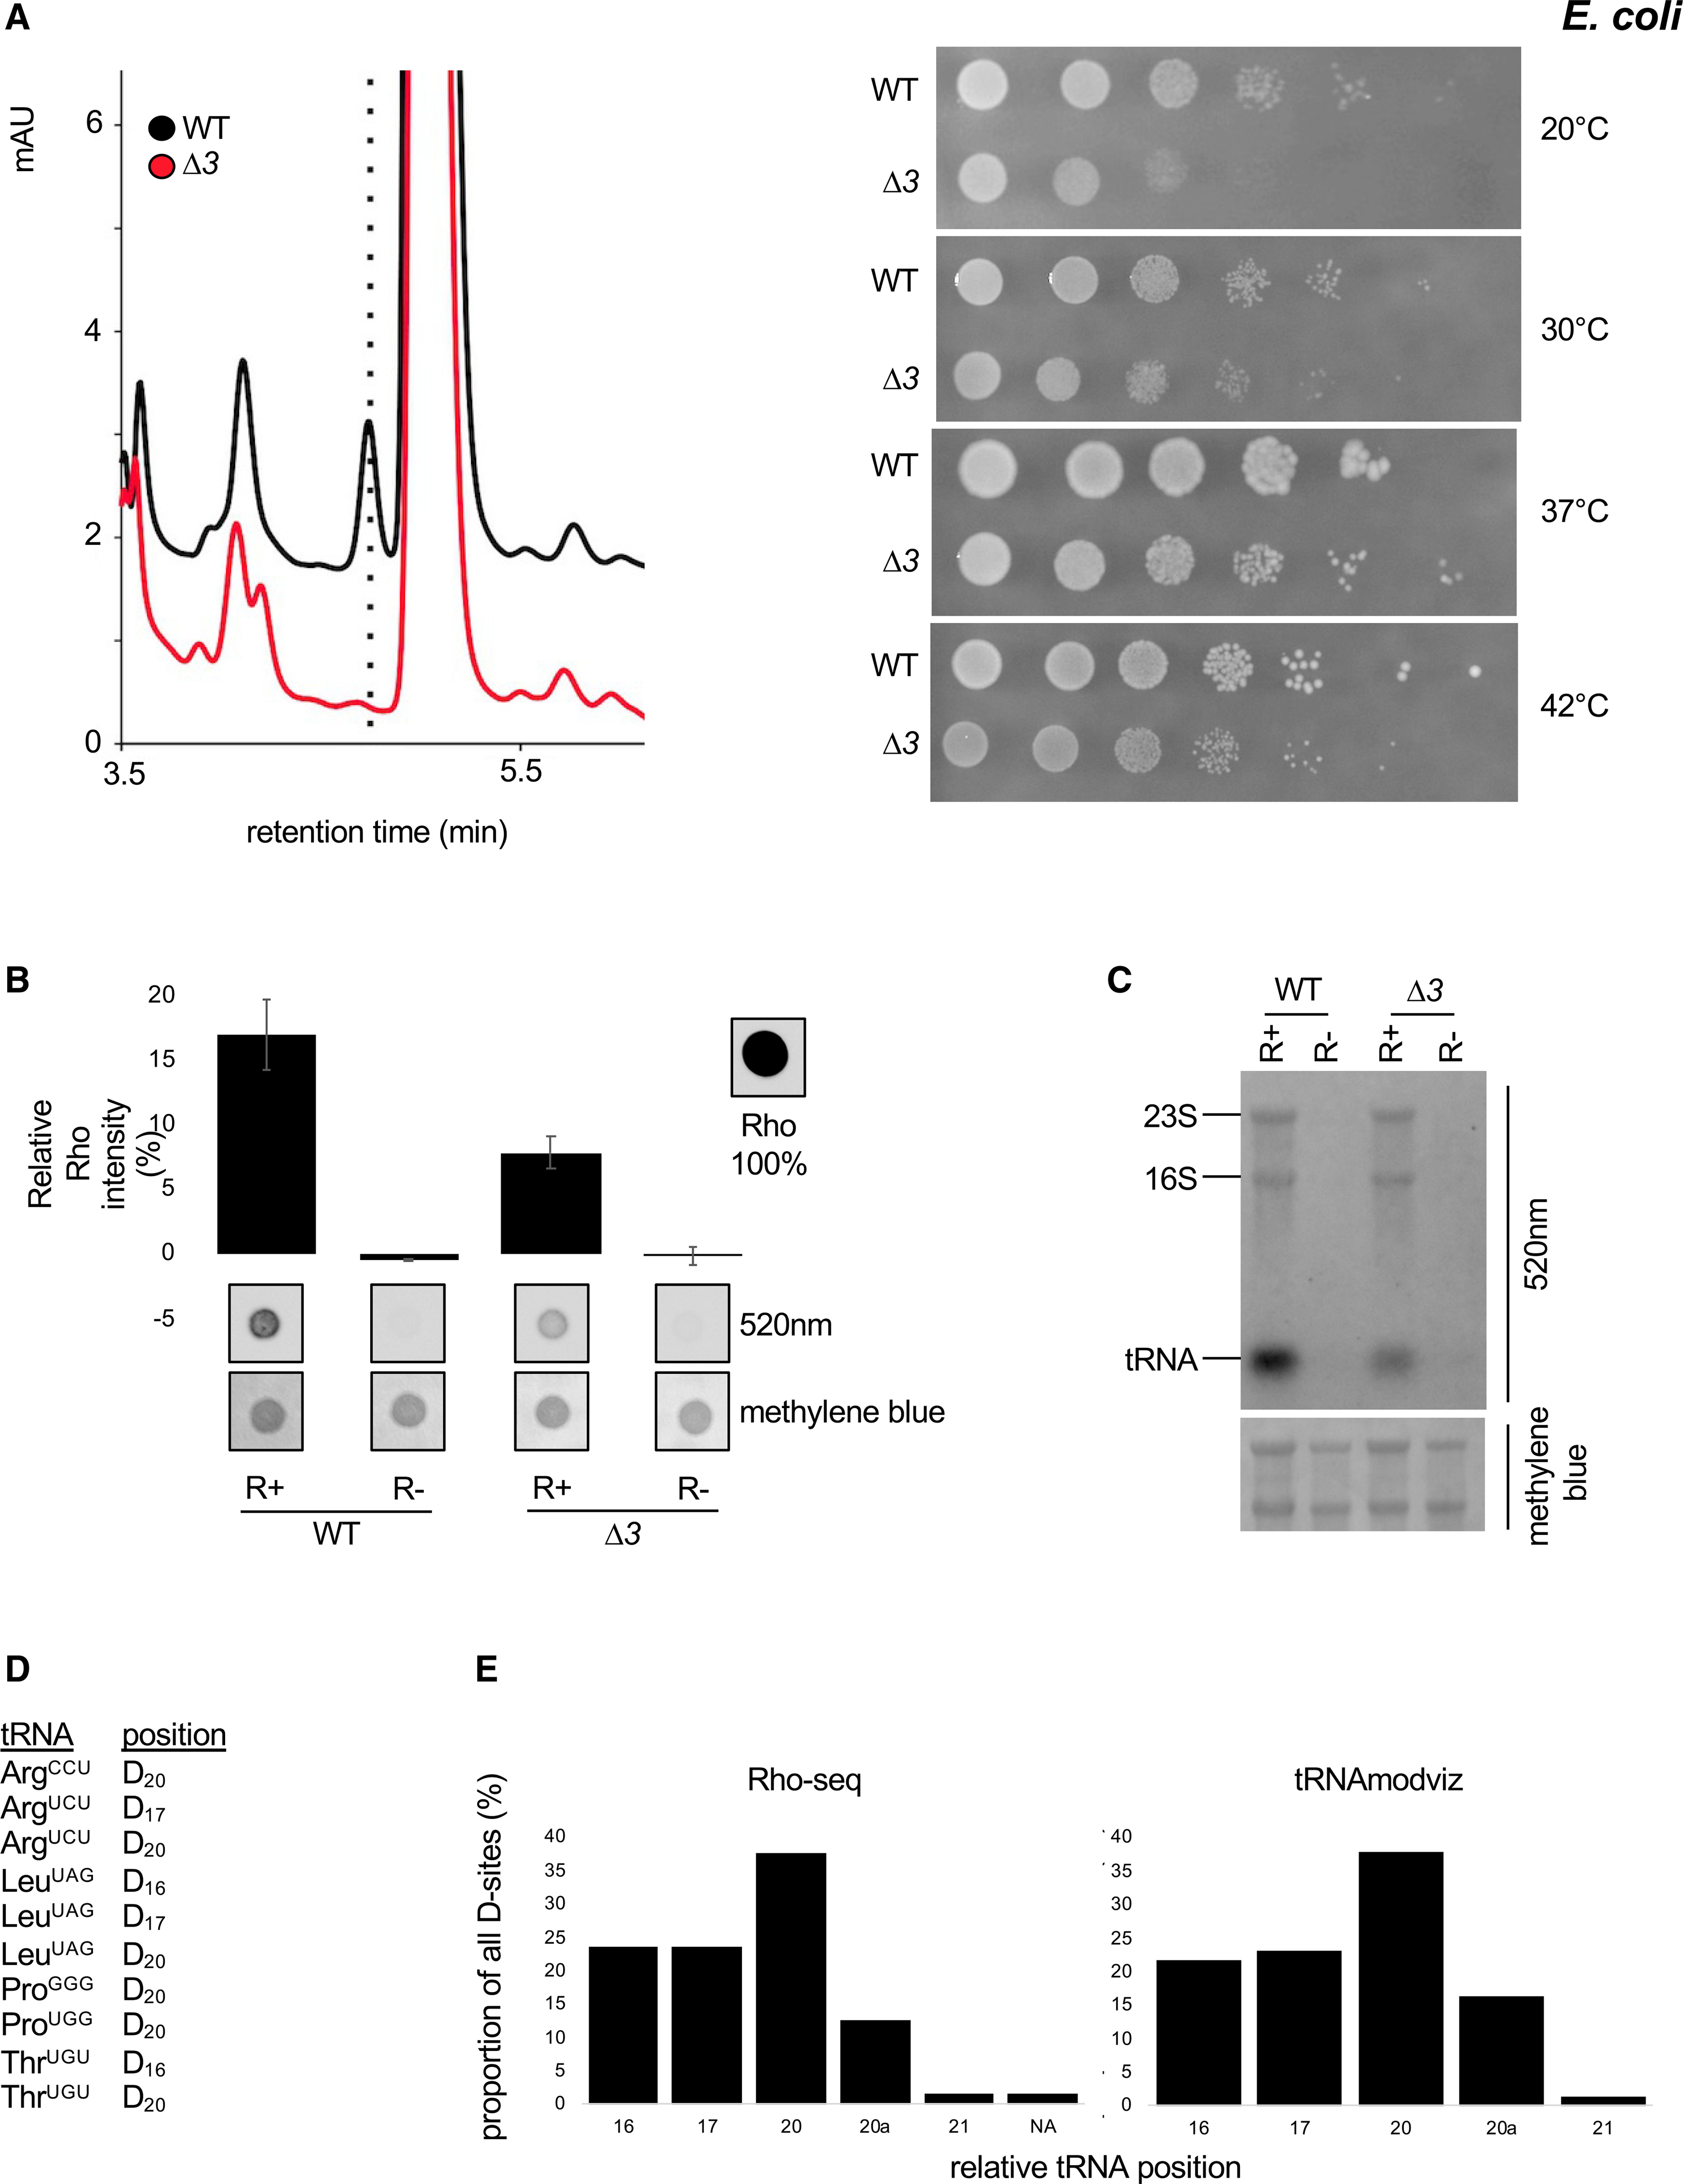
Figure 4. Implementation of Rho-seq on the E. coli transcriptome.

(A) Left: HPLC analysis of D content of RNA from a WT E. coli strain and a strain deleted for all dus gene family members. Right: chromatogram of pure D at the indicated concentrations. Right: growth assay at the indicated temperatures of a WT E. coli strain and a strain deleted for all dus gene family members.
(B) Comparative Rho (rhodamine) detection at 520 nm on WT (wild-type) and Δ3 (ΔdusA-B-C) total RNAs in R+ and mock-treated (R−) samples. Intensity of a Rho drop is scaled at 100%, a drop of water is considered as the background, and methylene blue staining serves as loading control. n = 3 biological replicates; error bars represent SEM.
(C) Fluorescent northern blotting of WT and Δ3 total RNAs in R+ and mock-treated samples. Representative result from a biological triplicate; methylene blue staining serves as loading control.
(D) Ten previously unknown positions (tRNAmodviz) on six E. coli tRNA species are found by Rho-seq to be dihydrouridinated.
(E) Left panel: distribution of the 63 unique tRNA D-sites identified by Rho-seq. NA, not assigned due to sequence incompatibility (D22 on tRNASerGGA). Right panel: distribution of the 74 unique tRNA D-sites as reported by the tRNAmodviz database.
