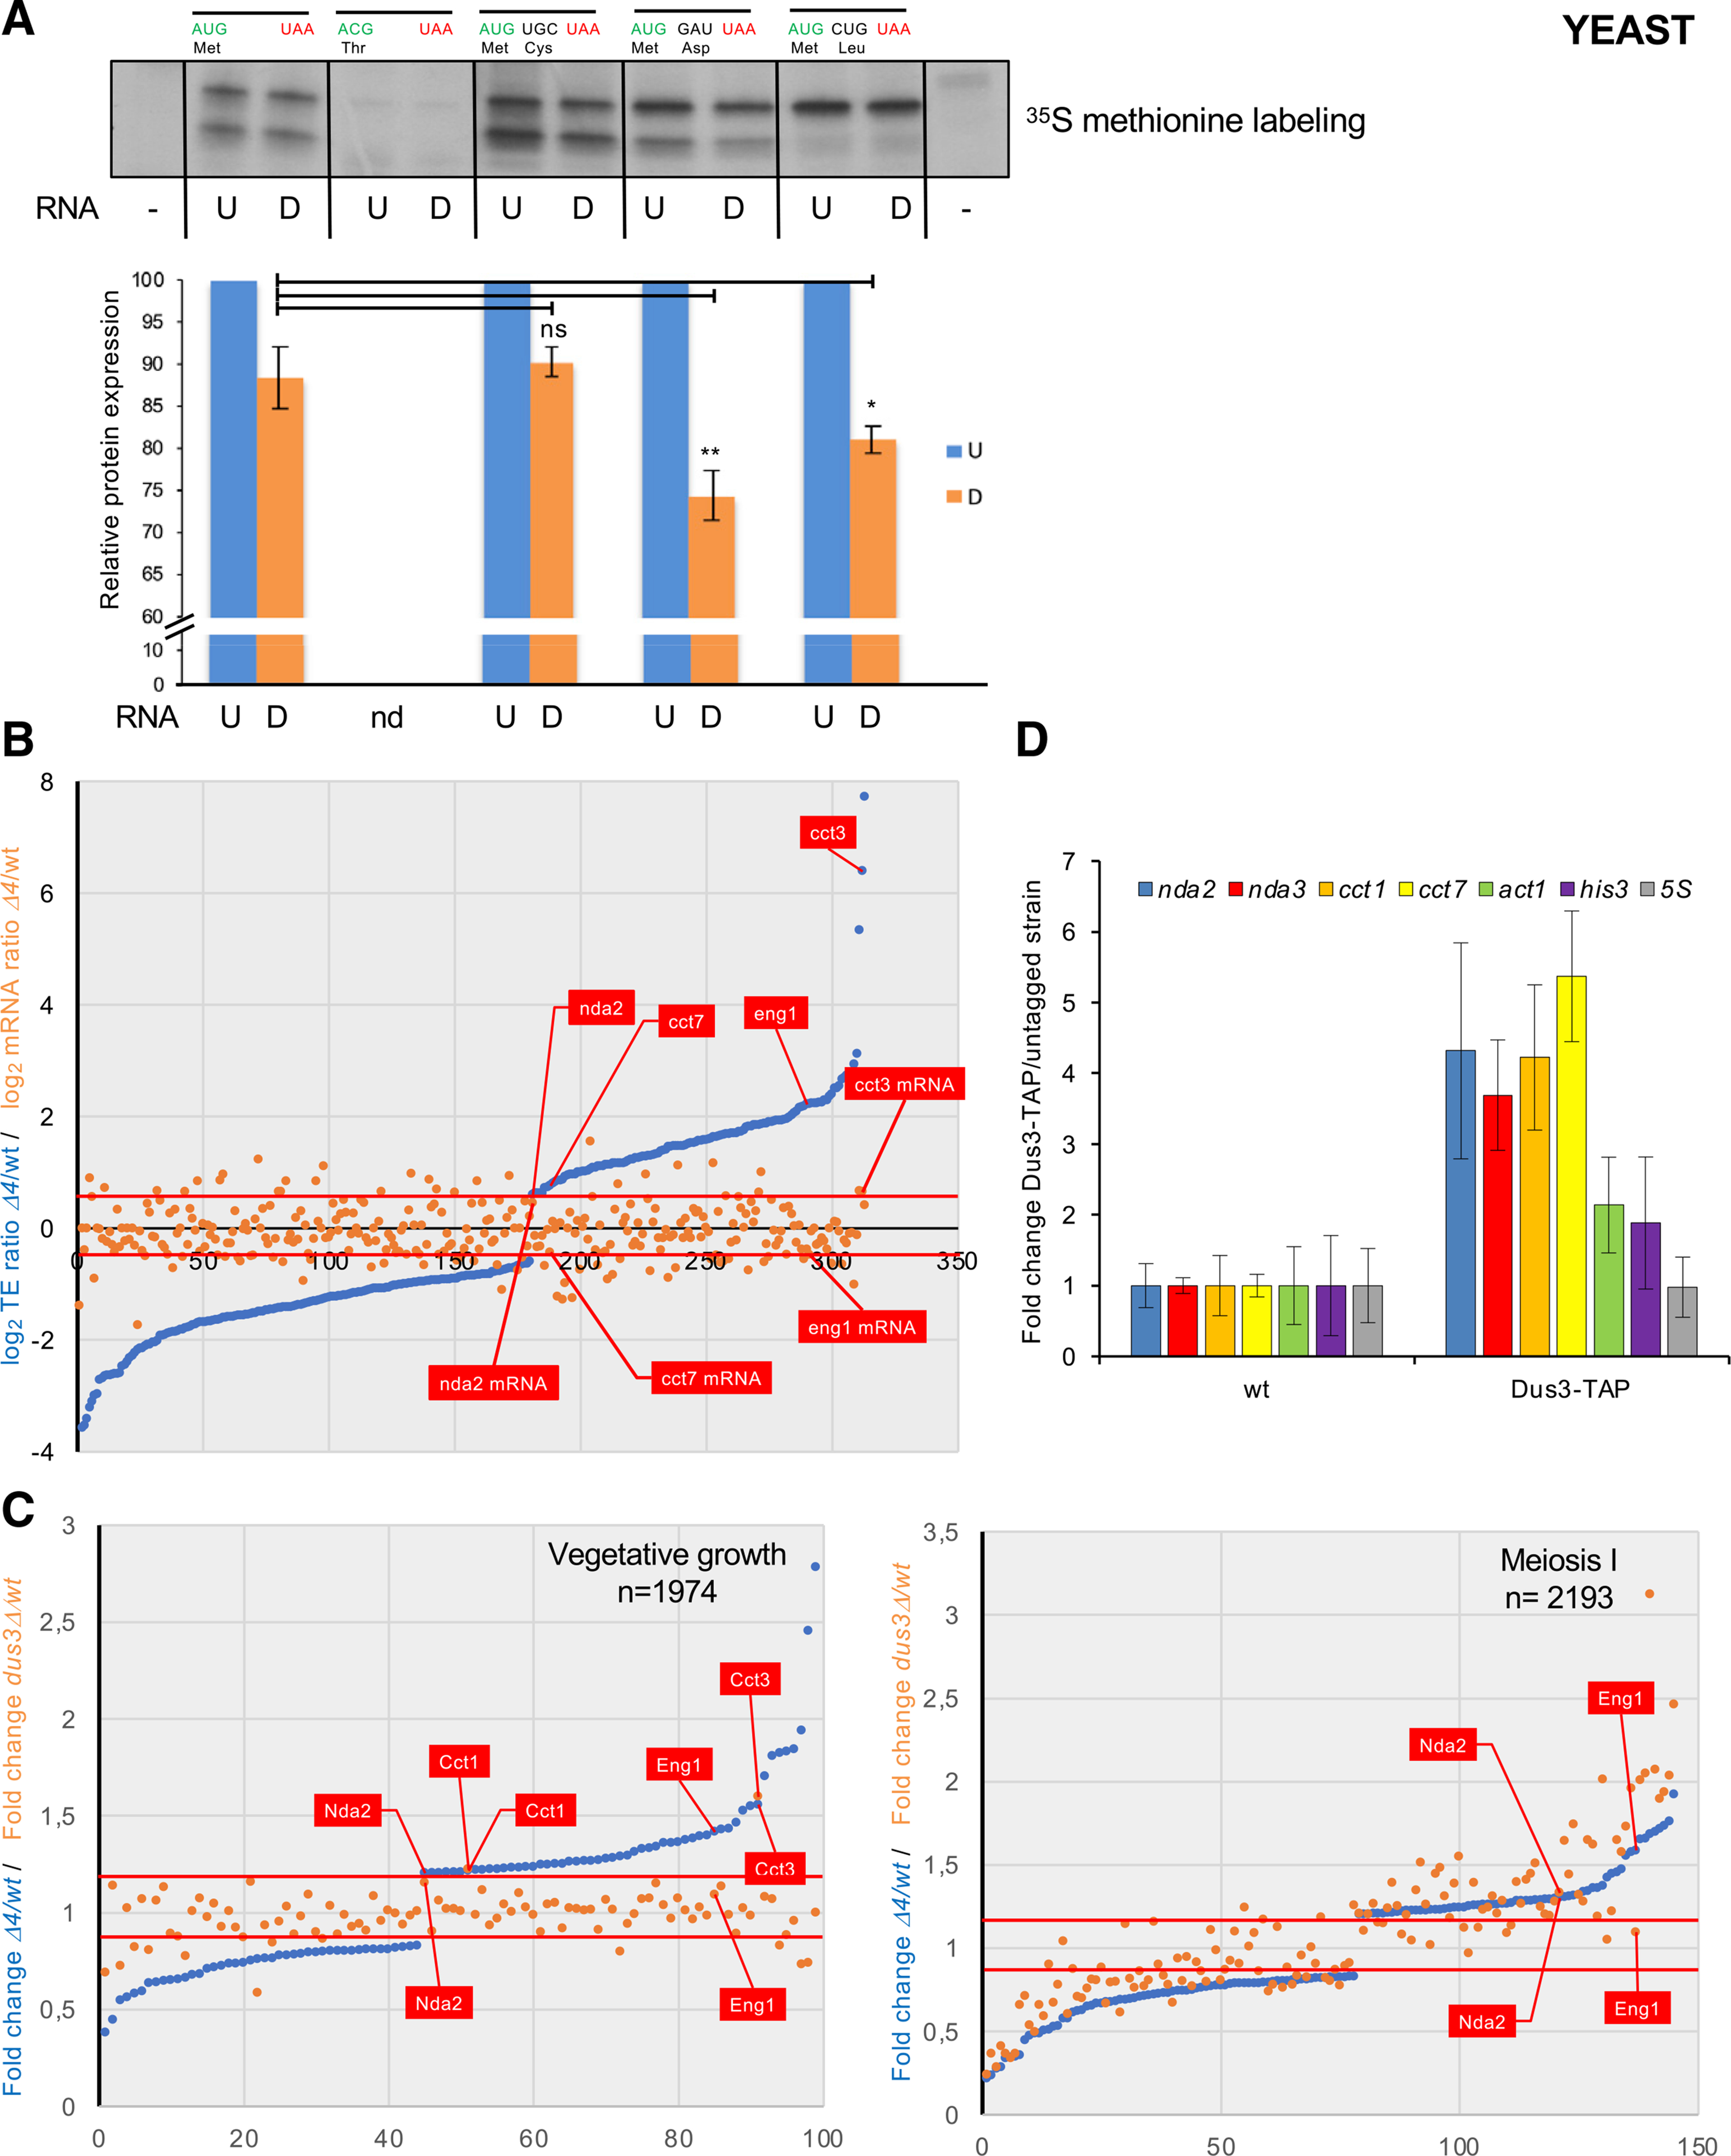
Figure 5. mRNA-associated D decreases the abundance of some encoded protein in vitro and in vivo.

(A) 35S methionine in vitro translation assay using in vitro-synthetized mRNAs with indicated codon specificity. The signal obtained from the uridine-containing RNA (U) was set as 1. Error bars represent standard error from three assays.
(B) Blue dots: 337 mRNAs sorted by translation efficiency fold change (Δ4/WT) with thresholds of a minimum 1.5-fold change and adjusted p value < 0.01 indicated by the two red lines. The orange dots show the fold change of the level (Δ4/WT) of the corresponding set of mRNAs. Translation efficiencies are normalized on mRNA level. The indicated nda2, cct7, eng1, and cct3 mRNAs were identified by Rho-seq.
(C) TMT-based quantitative proteomic analysis of the WT, Δ4, and dus3Δ strains during vegetative growth and meiosis.
Left panel, blue dots: 99 proteins sorted by mitotic growth expression fold change (Δ4/WT) with thresholds of a minimum 1.2-fold change and adjusted p value < 0.01 indicated by the two red lines. 1,974 proteins were detected in total by TMT-based analysis. The orange dots show the mitotic growth expression fold change (dus3Δ/WT) of the same set of proteins. The Nda2, Cct1, Eng1, and Cct3 proteins whose mRNAs were identified by Rho-seq are indicated.
Right panel, blue dots: 145 proteins sorted by meiotic growth expression fold change (Δ4/WT, Δ4/wild-type) with thresholds of a minimum 1.2-fold change and adjusted p value < 0.01 indicated by the two red lines. 2,193 proteins were detected in total by TMT-based analysis. The orange dots show the meiotic growth expression fold change (dus3Δ/WT) of the same set of proteins. The Nda2 and Eng1 proteins whose mRNAs were identified by Rho-seq are indicated.
(D) RNA immunoprecipitation (RIP) of Dus3-TAP of the untagged control. The fold change (Dus3-TAP/WT) of the indicated mRNAs is shown. Each column represents the averaged value ± SEM (n = 3 biological replicates).
