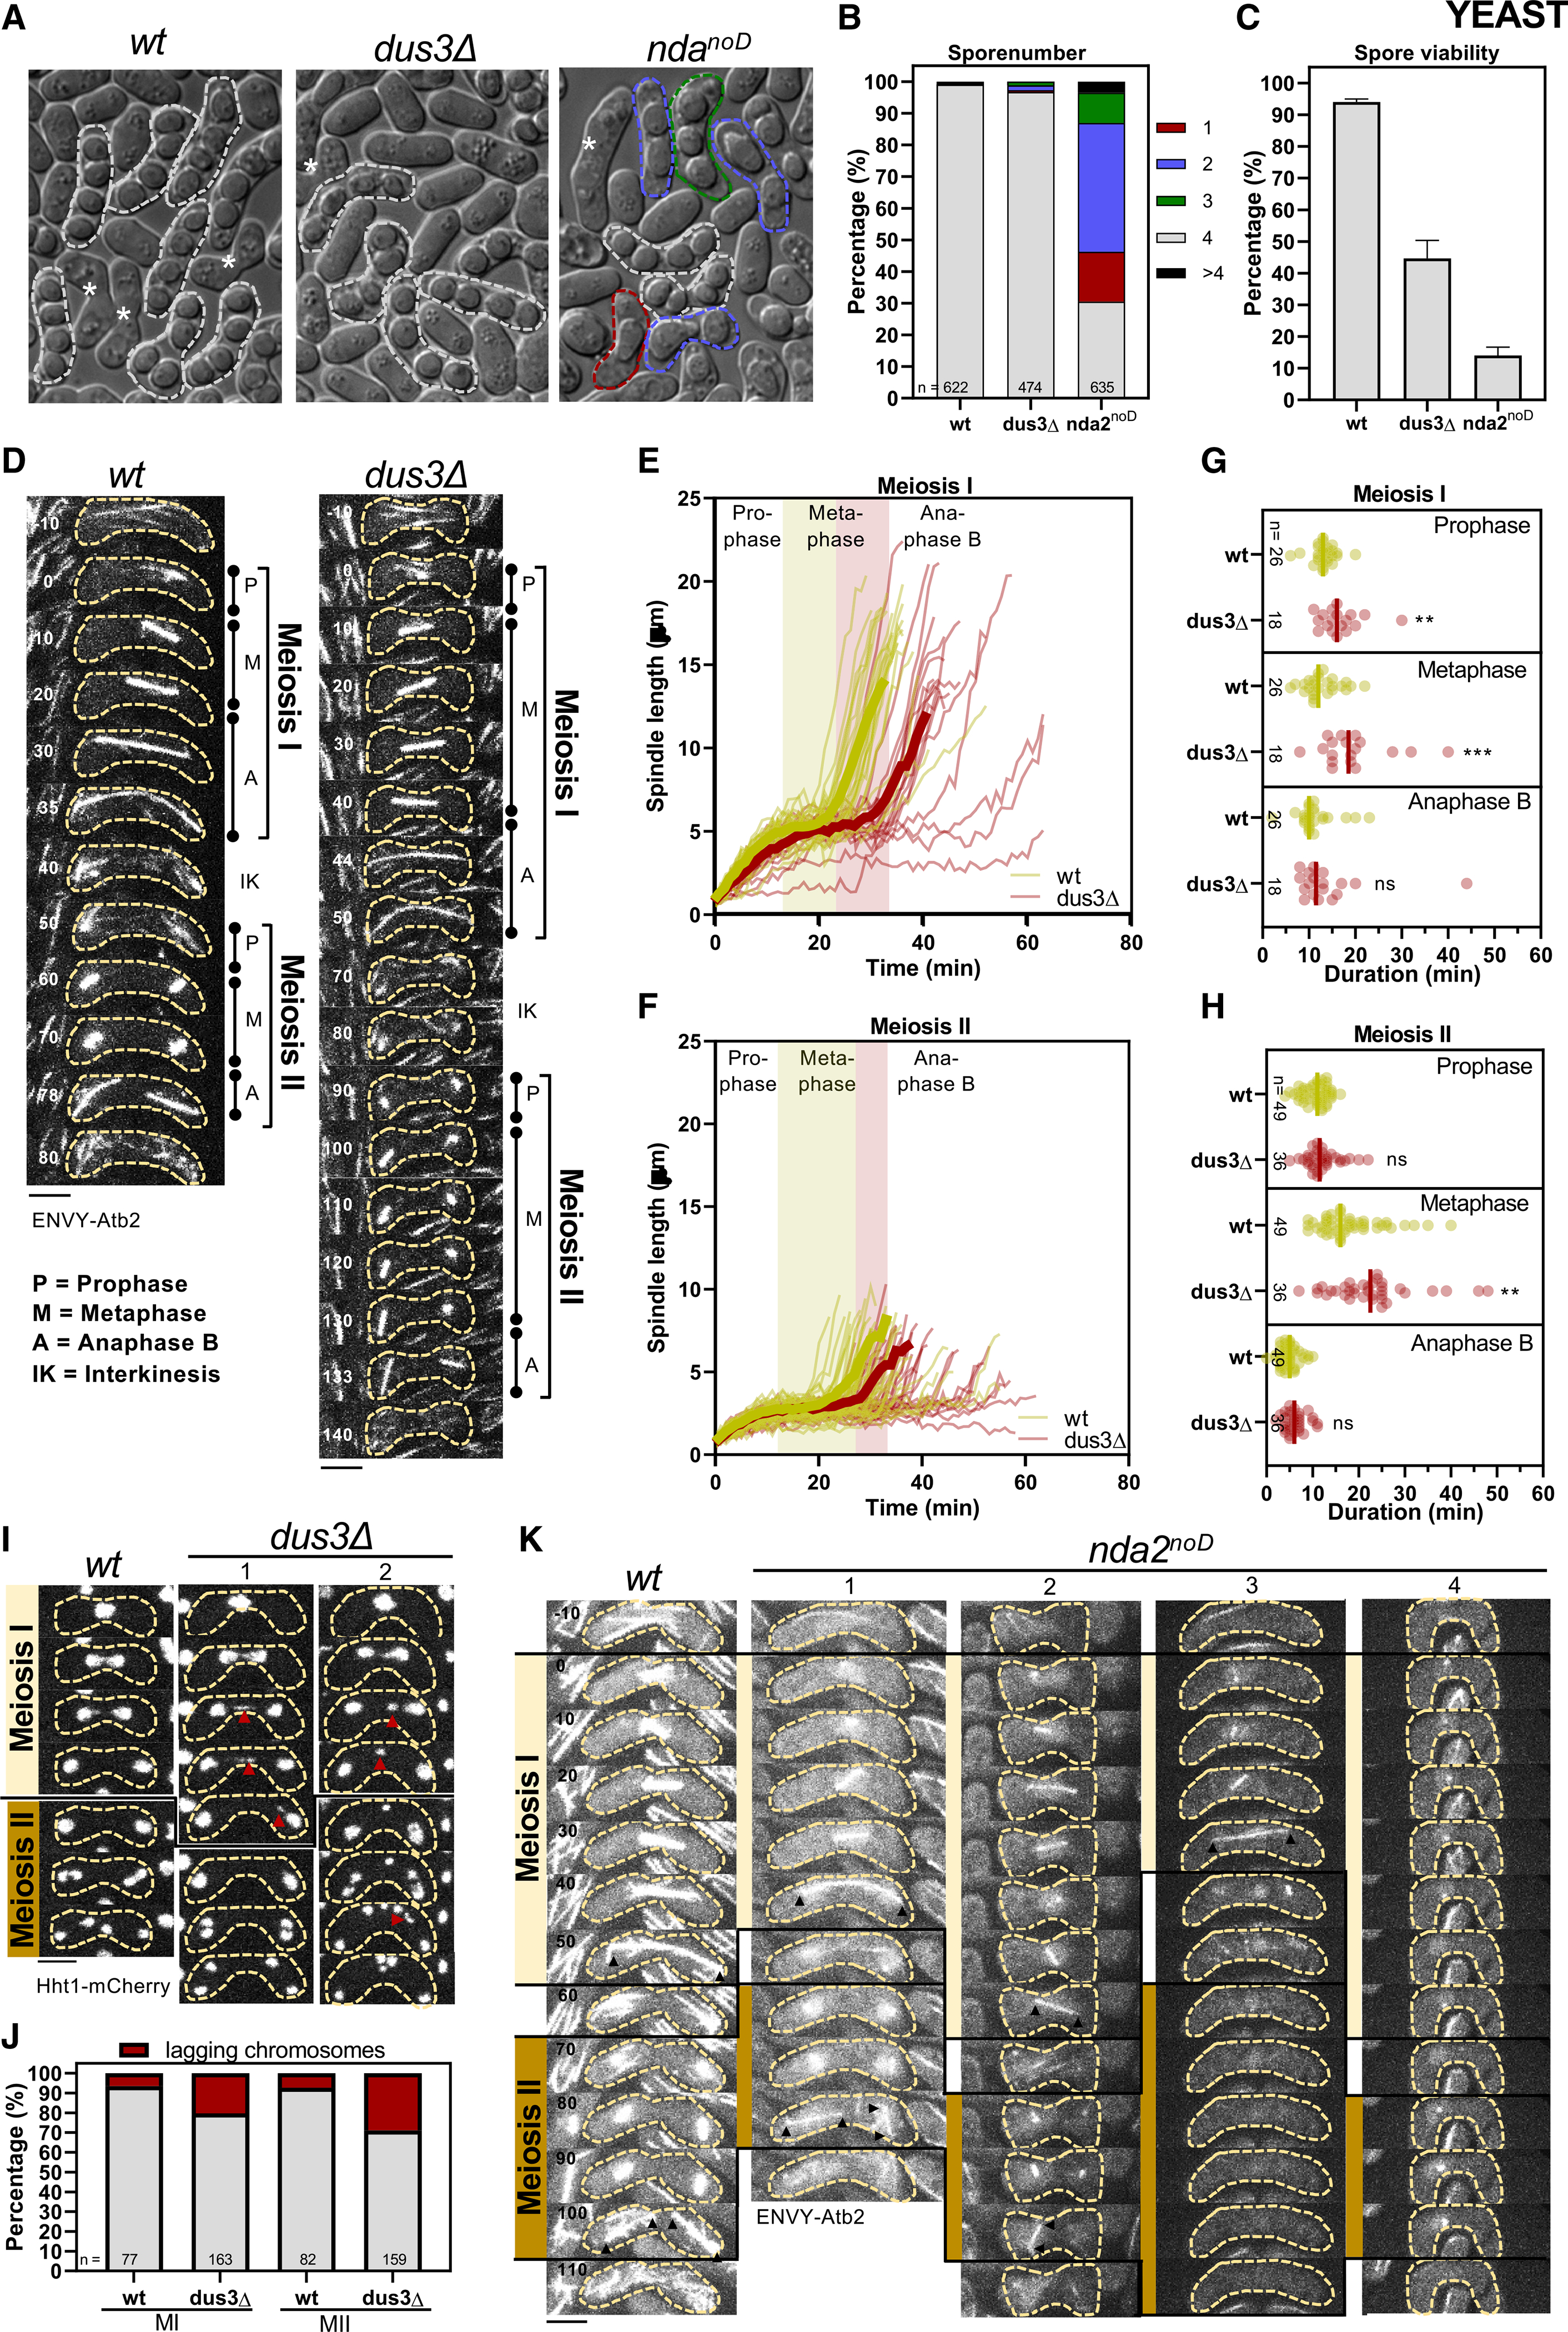
Figure 6. The deletion of dus3 or the absence of D on the nda2 mRNA results in meiotic spindle defects and low gamete viability.

(A) Brightfield images of h90 WT, nda2noD, and dus3Δ mutants after 48 h on malt extract (ME) plates. Zygotes without spores (gametes) are marked by an asterisk, the dashed white line marks zygotes with 4 spores, and dashed green, blue, and red lines mark zygotes with aberrant spore numbers.
(B) Stacked bar plot of the spore number per zygote of h90 WT, nda2noD, and dus3Δ mutants.
(C) Gamete viability was assessed from the ability of gametes to form colonies in the indicated strains. Error bars represent the standard error from three biological replicates.
(D) Time-lapse images of WT and the dus3Δ cells expressing ENVY-Atb2 (α-tubulin). Scale bar, 5 μm.
(E and F) Comparative plot of spindle length dynamics of WT (n = 26 spindles) and the dus3Δ cells (n = 18 spindles). Bold curves correspond to mean spindle dynamics. Green bar illustrates the metaphase duration of WT cells and the red bar the additional time needed for metaphase in the dus3Δ cell.
(G and H) Dot plot comparison of the duration of the meiotic phases for the WT and dus3Δ mutant. p values were calculated by Mann-Whitney U test.
(I) Time-lapse images of WT and dus3Δ cells expressing Hht1-RFP. Lagging chromosomes are marked by the red arrowheads. Time interval corresponds to 10 min. Scale bar, 5 μm.
(J) Stacked bar plot of the number of WT and dus3Δ cells with lagging chromosomes during meiosis I and meiosis II.
(K) Time-lapse images of WT and nda2noD mutant expressing ENVY-Atb2. Arrowheads illustrate spindle poles of final MI or MII spindles. Scale bar, 5 μm. Representative pictures are shown: zygotes forming normal MI and MII spindles (1), zygotes forming an MI spindle but only one MII spindle (2), zygotes forming an MI spindle but no MII spindle (3), zygotes forming no proper MI or MII spindle (4).
