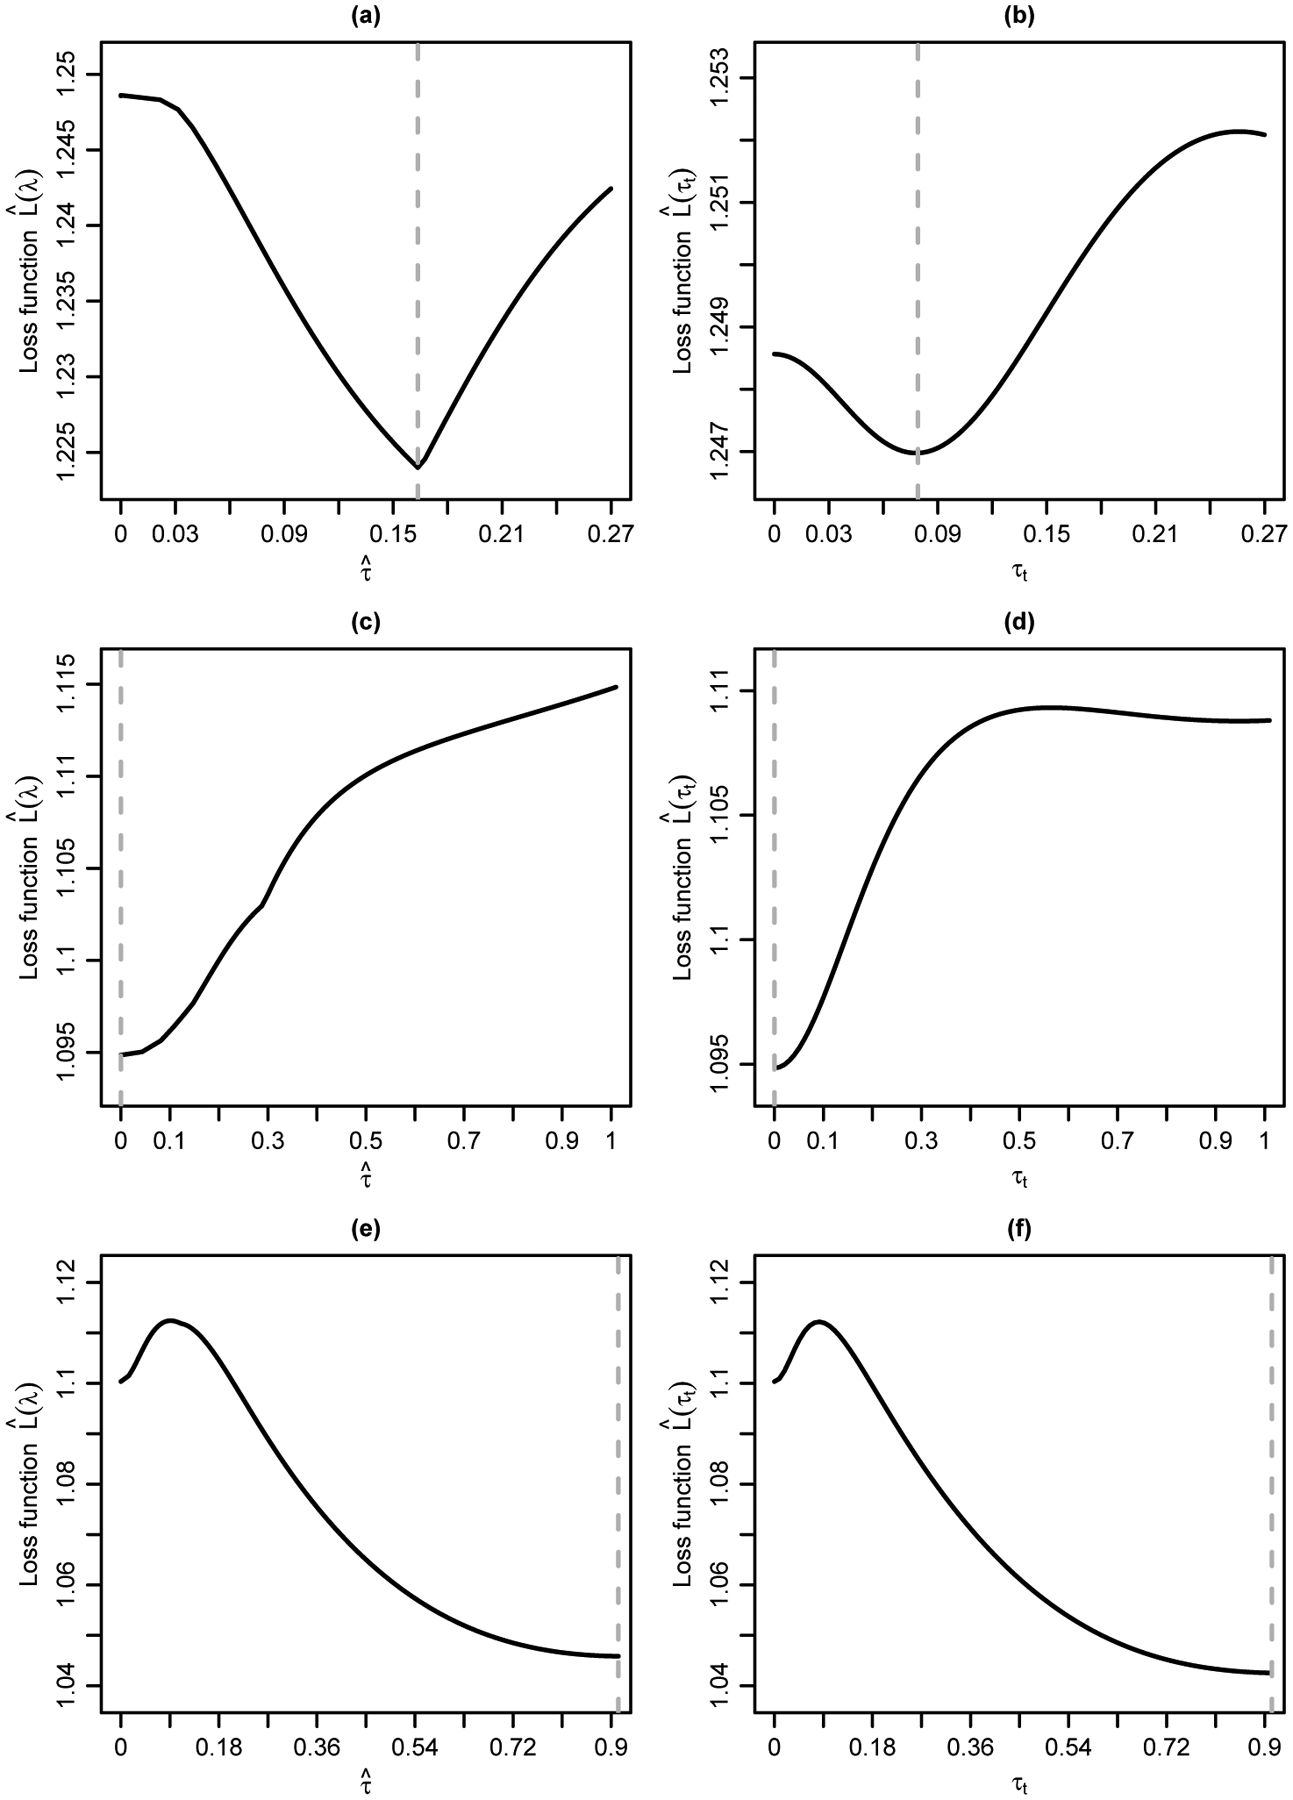
FIGURE 4.

Loss functions for the meta-analyses by Storebø et al.33 (upper panels), by Carless et al.34 (middle panels), and by Bjelakovic et al.35 (lower panels). The left panels show the loss functions by tuning λ against the estimated between-study standard deviation; the right panels show the loss functions by tuning τ against τt. Each vertical dashed line represents the optimal value that yields the minimum loss.
