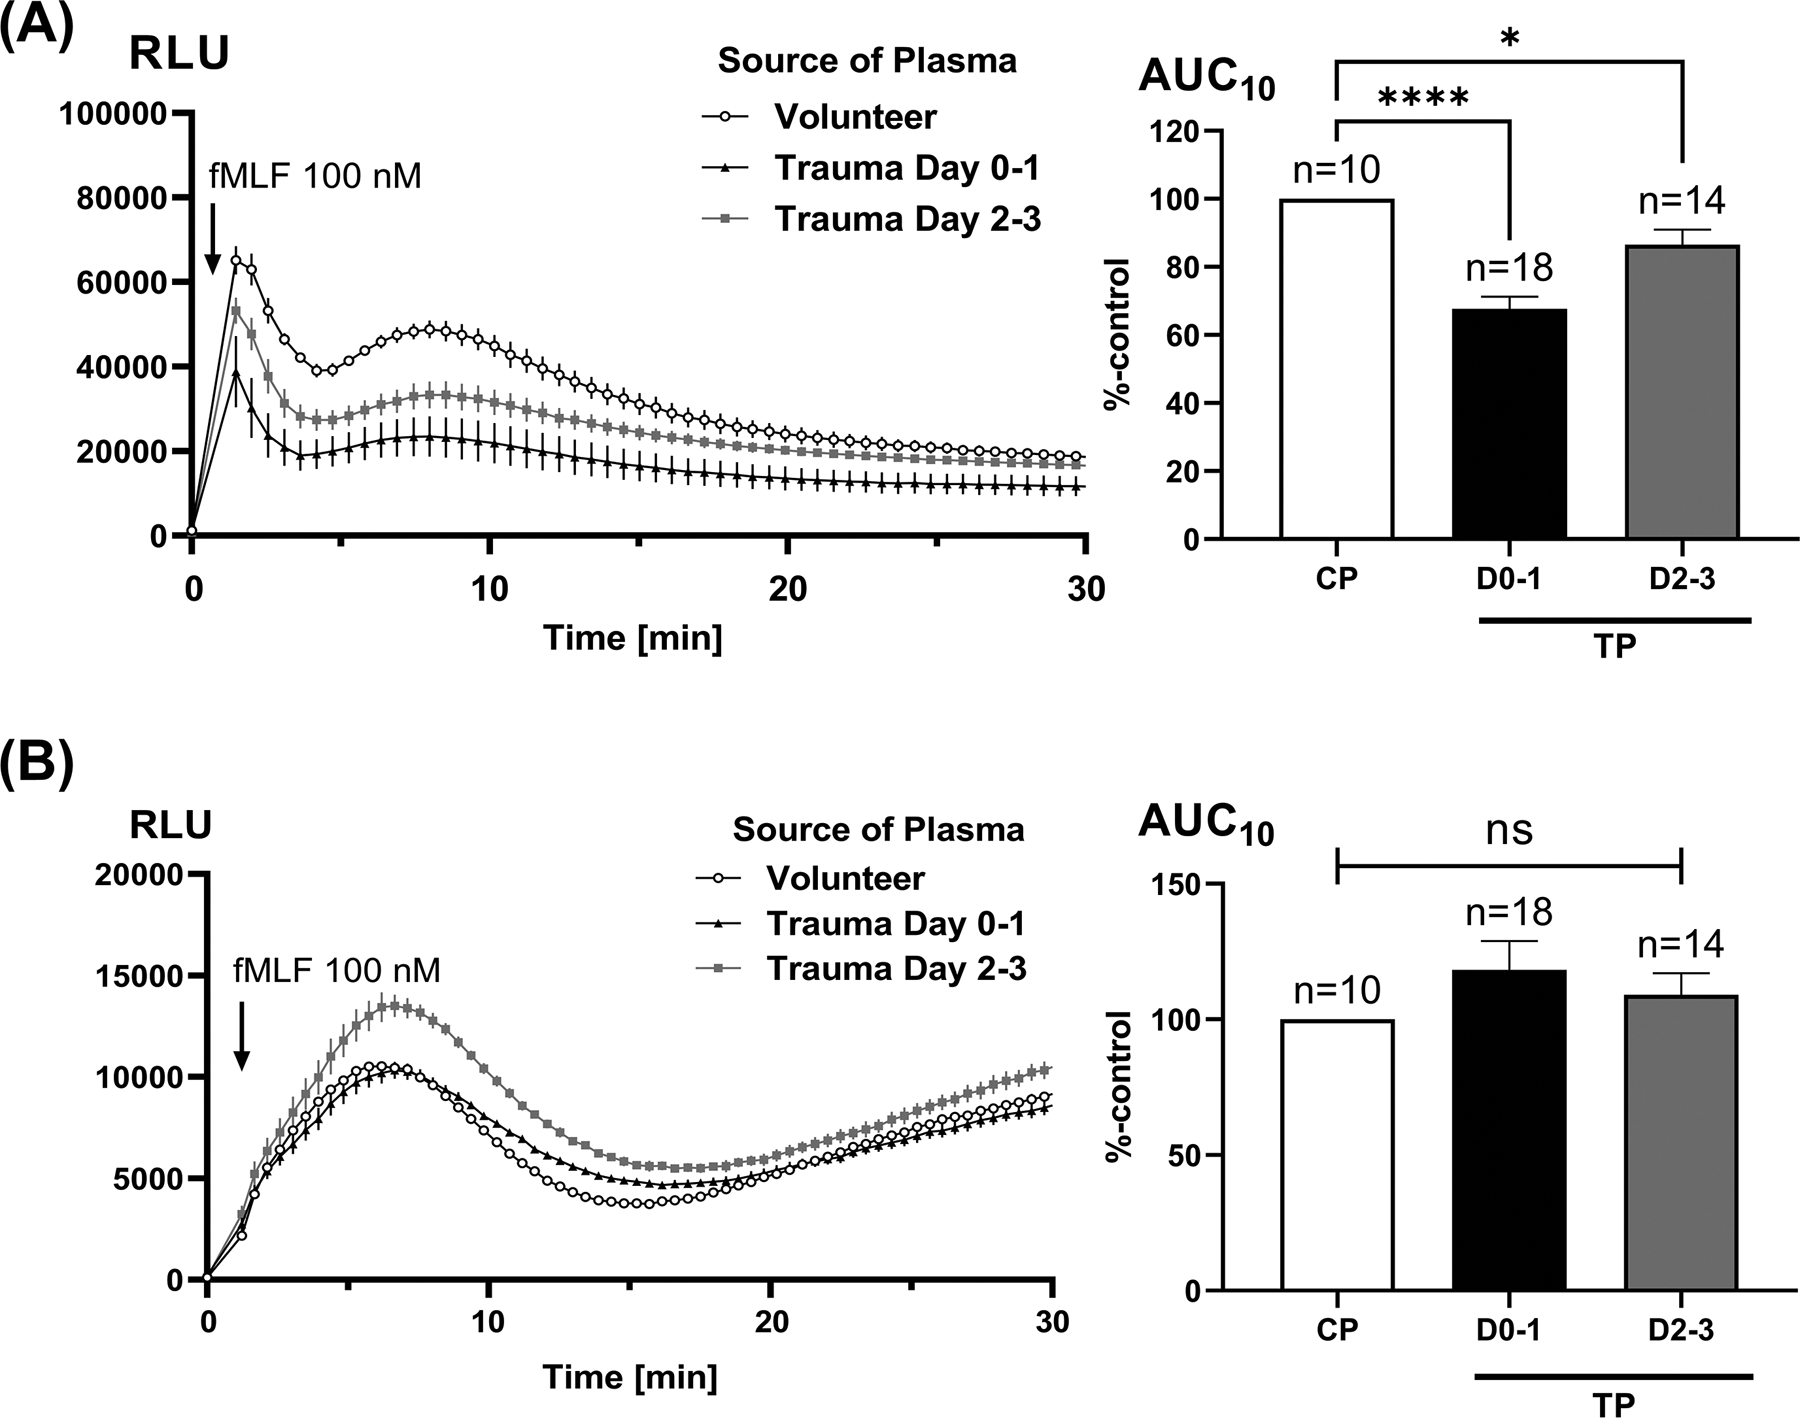
Figure 2. Effect of trauma plasma on fMLF-induced total (Panel A) and intracellular PMN RB.

Intracellular RB (Panel B) was assessed by stimulating cells in the presence of the extra-cellular oxidant scavengers SOD and catalase (see methods). Healthy PMN were incubated with 10% trauma plasma (TP) from samples taken on either Day 0 to 1 (D0–1) or Day 2 to 3 (D2–3) for 25 min. fMLF-induced RB was measured for 30 min using a luminometer (left sided traces). Note that total RB values and RB elicited by PMA are typically much larger than intracellular RB and receptor dependent RB. The scales of the luminometry graphs are typically modified to demonstrate differences where needed. The standard error bars are drawn to scale. The areas under the curve (AUC) for luminol activation over 10 min were calculated (right hand graphs) and compared using one-way ANOVA / Tukey’s test (*p<0.05; ****p<0.001). CP, control plasma; TP, trauma plasma; RLU, relative light units.
