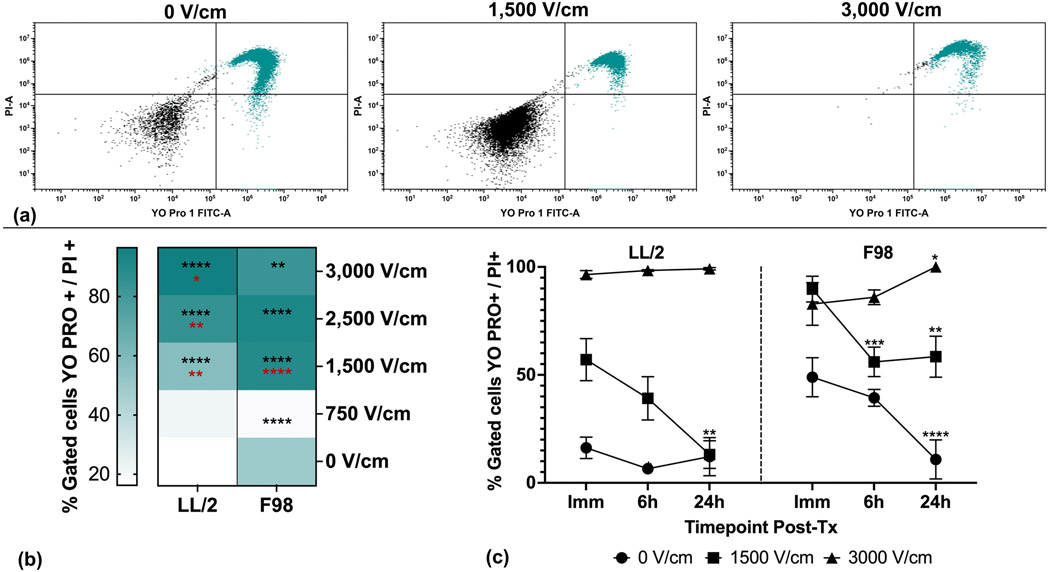
Figure 1. H-FIRE induces dose-dependent irreversible and recoverable tumor cell membrane permeability.
Suspensions of 1×10⁶ cancer cells were treated with a single in vitro H-FIRE treatment protocol using escalating electric fields. Cells were stained and analyzed by flow cytometry immediately, 6h, and 24h post-treatment. YO-PRO®-1 and PI exclusion dye staining was used to quantify membrane permeability. (a) Representative flow cytometry dot plots and gating of LL/2 cells treated with 0, 1,500, and 3,000 V/cm H-FIRE showing immediate post-treatment YO-PRO®-1 and PI permeabiliy (green dots, right upper and lower quandrants). (b) Tumor cell membrane permeability (YO-PRO®-1 and PI double-positive cells) for all treatment levels for the immediate post-treatment timepoint. Percentages of cells permeabilized are presented as mean. Significant differences are shown between each treatment level and the sham group with black stars. Statistically significant differences are shown between each treatment level and the immediately preceding treatment level with red stars. (c) Temporal profiles of tumor cell permeability for select treatment levels that resulted in significant recovery of membrane permeability by 24 hours post-treatment (1,500 V/cm), no recovery (3,000 V/cm), and sham. Data are presented as mean ± SD. Significant differences between timepoints are noted compared to immediate post-treatment timepoint within each treatment level. Statistical analysis using a two-way ANOVA (Mixed Effects). ns p ≥ 0.05, * p< 0.05, ** p < 0.01,*** p < 0.001, **** p ≤ 0.0001. n≥3 for all groups.

