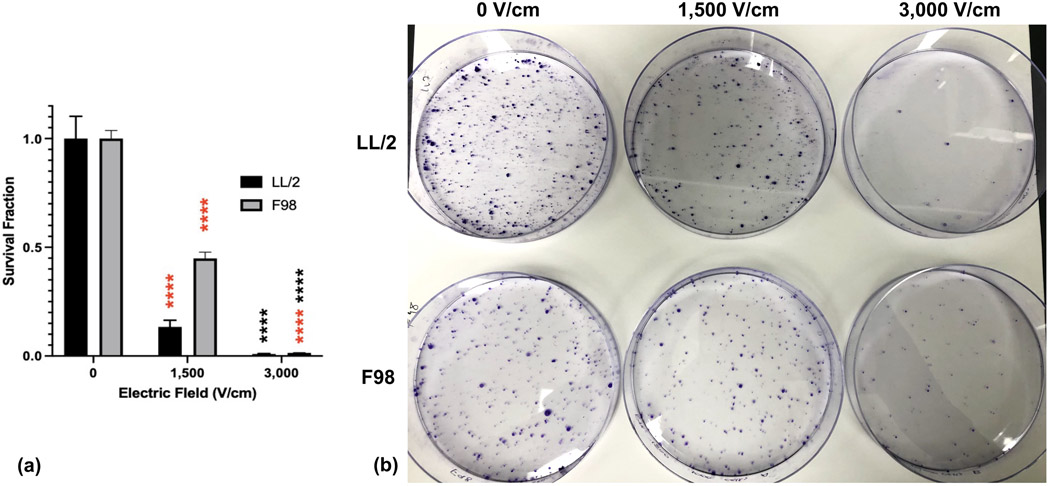
Figure 3. Tumor cells treated with damage recovery-permitting doses of H-FIRE maintain proliferative capacity.
Suspensions of 1×10⁶ cancer cells were treated with a single in vitro H-FIRE treatment protocol at 0, 1,500, 3,000 V/cm and seeded in culture dishes at predetermined densities. Cells were incubated with growth media for 8 days and observed for colony formation. Colonies were stained with crystal violet to visualize and quantify colony formation and proliferative capacity. a) Survival fractions of tumor cell lines treated with varying doses of H-FIRE normalized to sham. Data are presentated as mean ± SD. Significant differences are noted between sequential electric fields in red and compared with sham in black. Statistical analysis using one-way ANOVA. ns p ≥ 0.05, * p< 0.05, ** p < 0.01, *** p < 0.001, **** p ≤ 0.0001. n≥3 for all groups. (b) Clonogenic assay plates for LL/2 and F98 tumor cell lines treated with specified doses of H-FIRE. Purple dots indicate cancer colonies.

