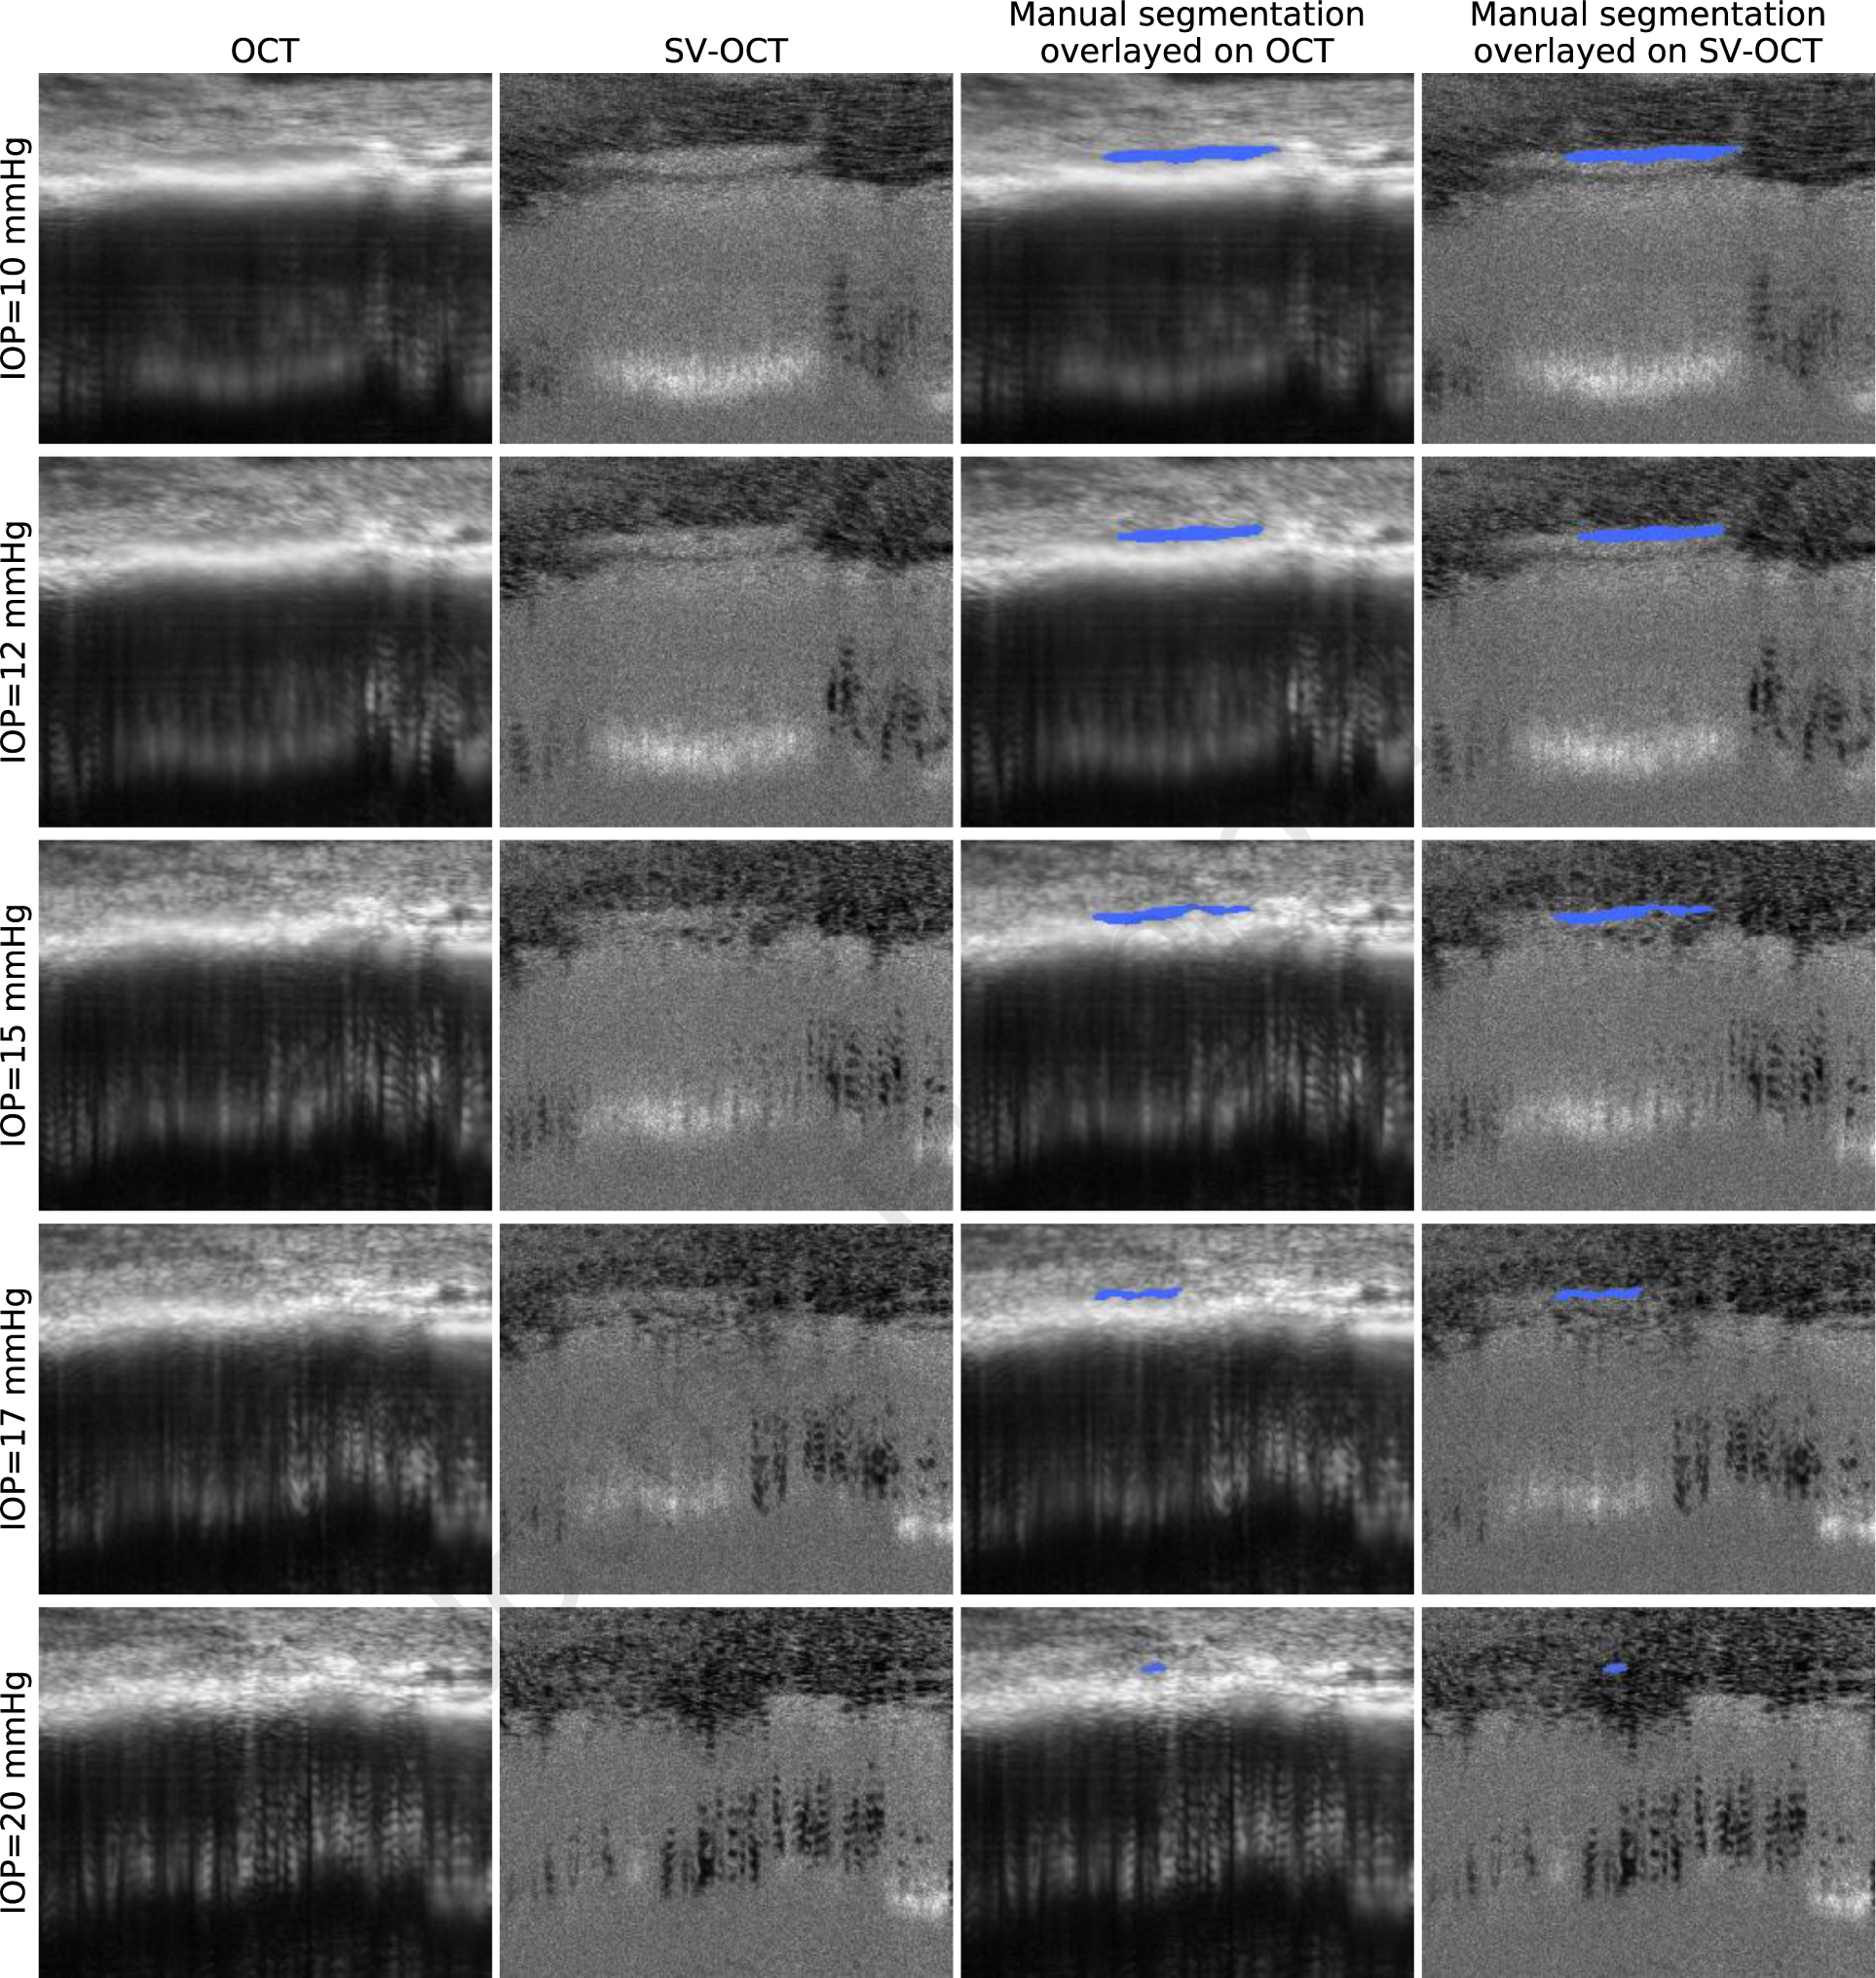
Figure 1.

Visualization and manual segmentation of SC in OCT images of a living mouse eye. Each row represents OCT imaging data and corresponding overlayed ground truth annotations acquired on the same eye at a different IOP level (from top to bottom: 10, 12, 15, 17, 20 mmHg). Each column from left to right represents the intensity OCT image, the SV-OCT image, the ground truth overlayed on the intensity OCT image, and the ground truth overlayed on the SV-OCT image.
