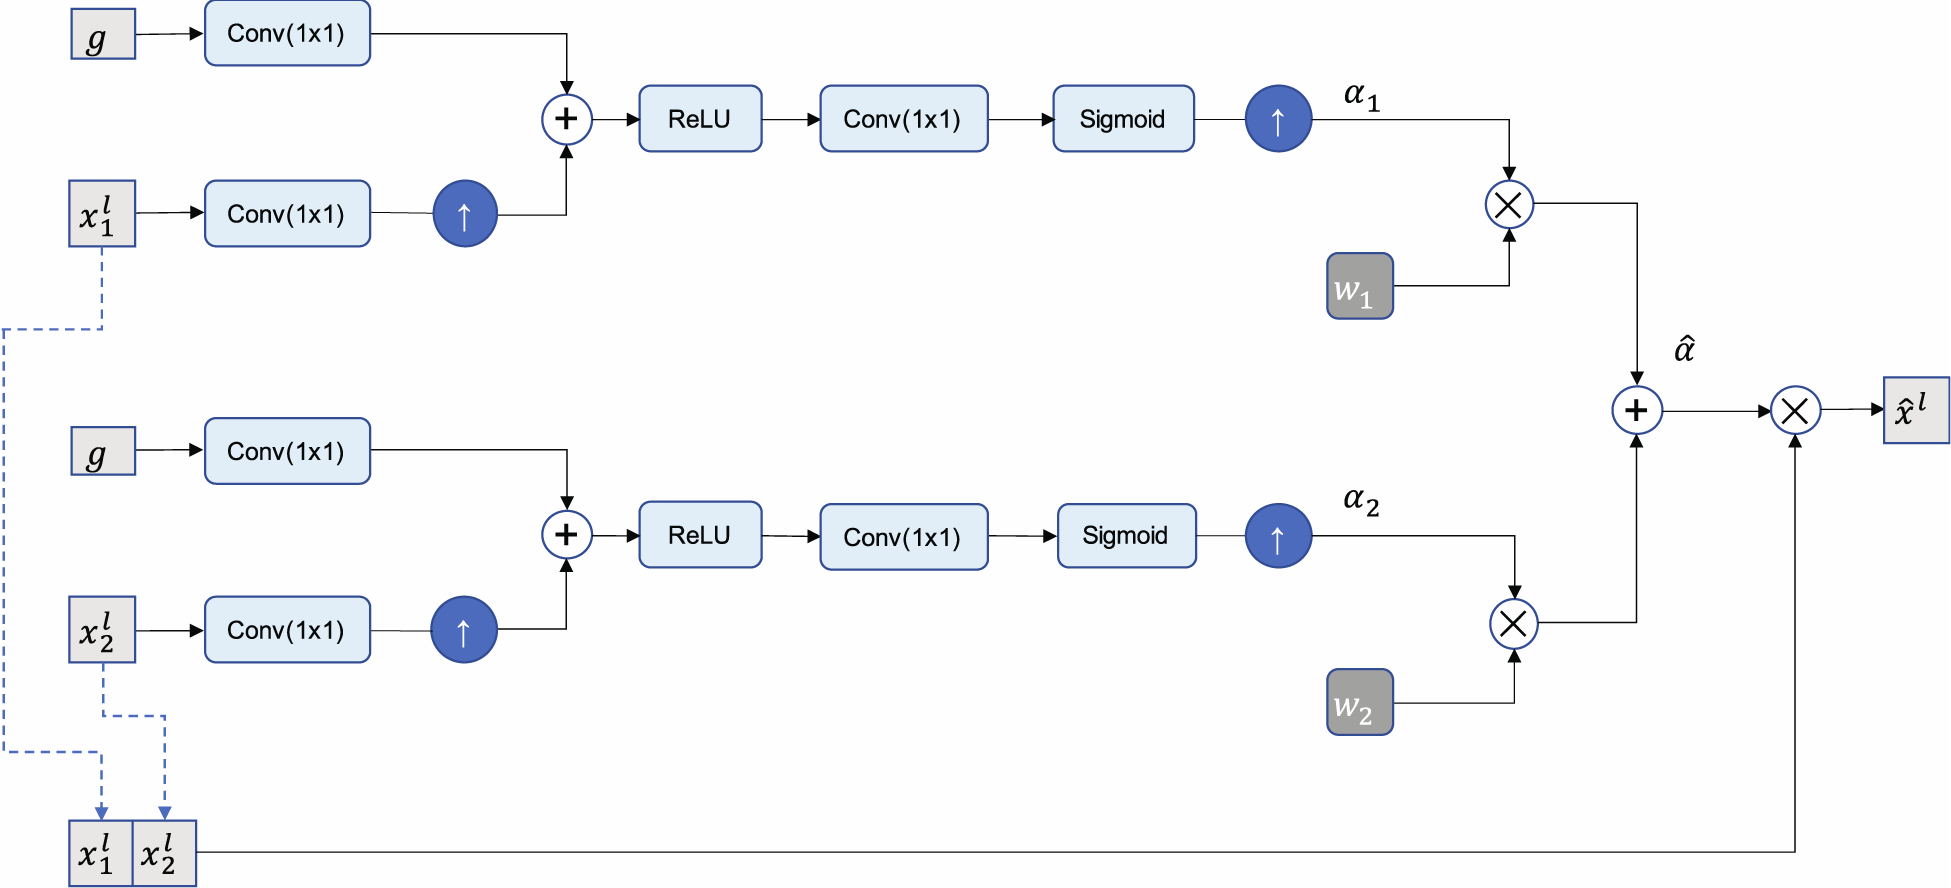
Figure 4.

Diagram of the late fusion attention gate. Feature maps xl are scaled by attention coefficients , which are obtained by taking the weighted sum of attention coefficients learned for OCT and SV-OCT inputs. A gating signal, g, obtained from a coarser resolution, is used to determine salient regions and prune less relevant features.
