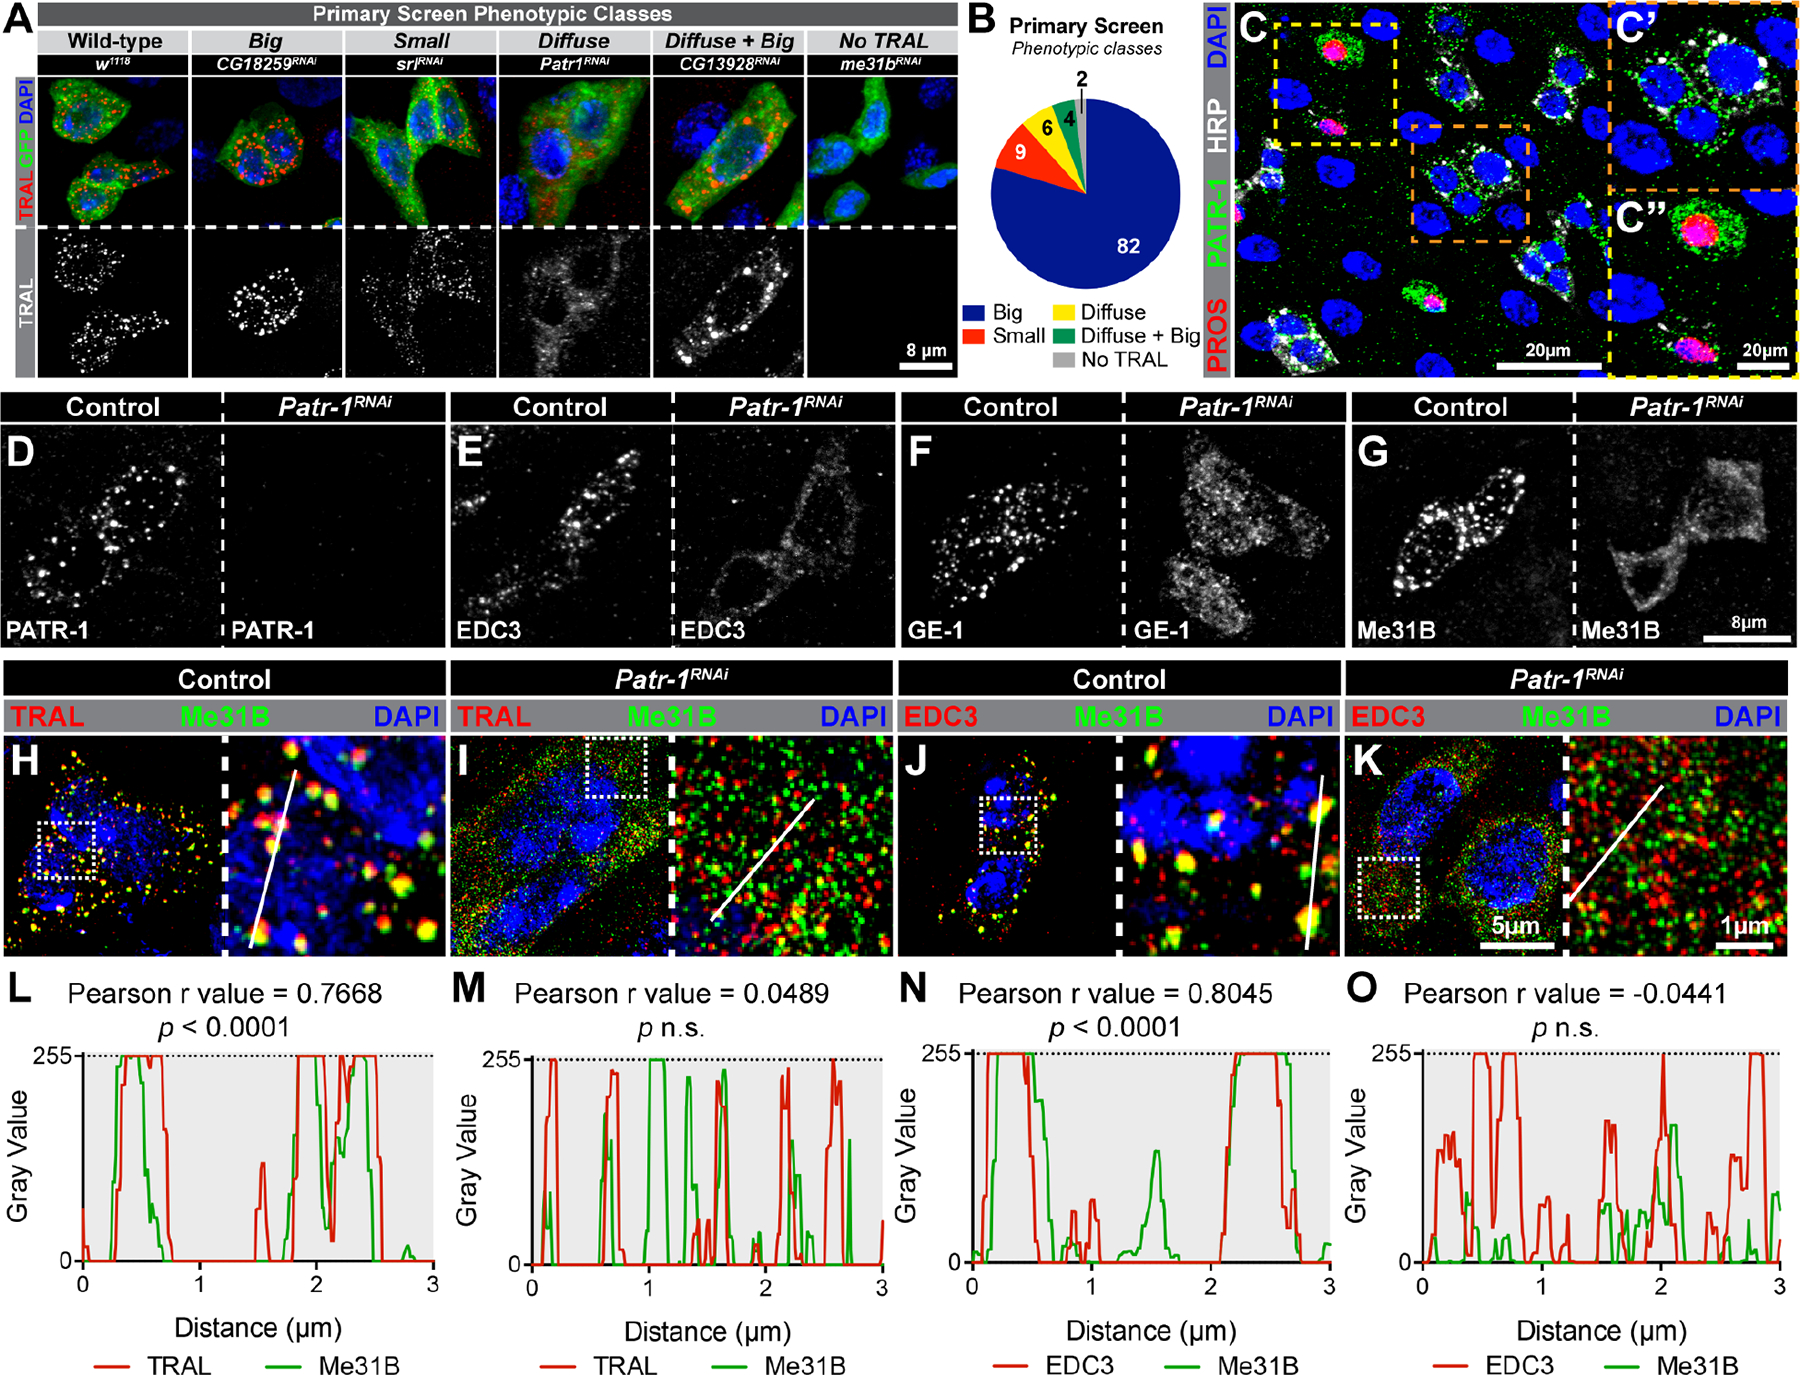
Figure 2. RNAi screen identifies PATR-1 as an essential component of progenitor cell P-bodies.

(A) Progenitor cells stained for TRAL (red), progenitor cells (green), and DAPI (blue) after knockdown of selected genes. (B) Numbers per phenotypic class. (C) PMG stained for PROS (red), PATR-1 (green), HRP (white) and DAPI (blue). C’ and C” are enlargements of indicated regions. (D-G) Progenitor cells from control and Patr-1 RNAi intestines stained for PATR-1, EDC3, GE-1, or Me31B. (H-K) Super-resolution micrographs of control and Patr-1 RNAi intestinal progenitors stained for Me31B (green), DAPI (blue) and either TRAL or EDC3 (red). (L-O) Normalized pixel-by-pixel fluorescent intensity profiles of indicated protein (TRAL, Me31B or EDC3) along white lines in H-K. Full genotypes listed in Data S1F. See also Figure S2.
