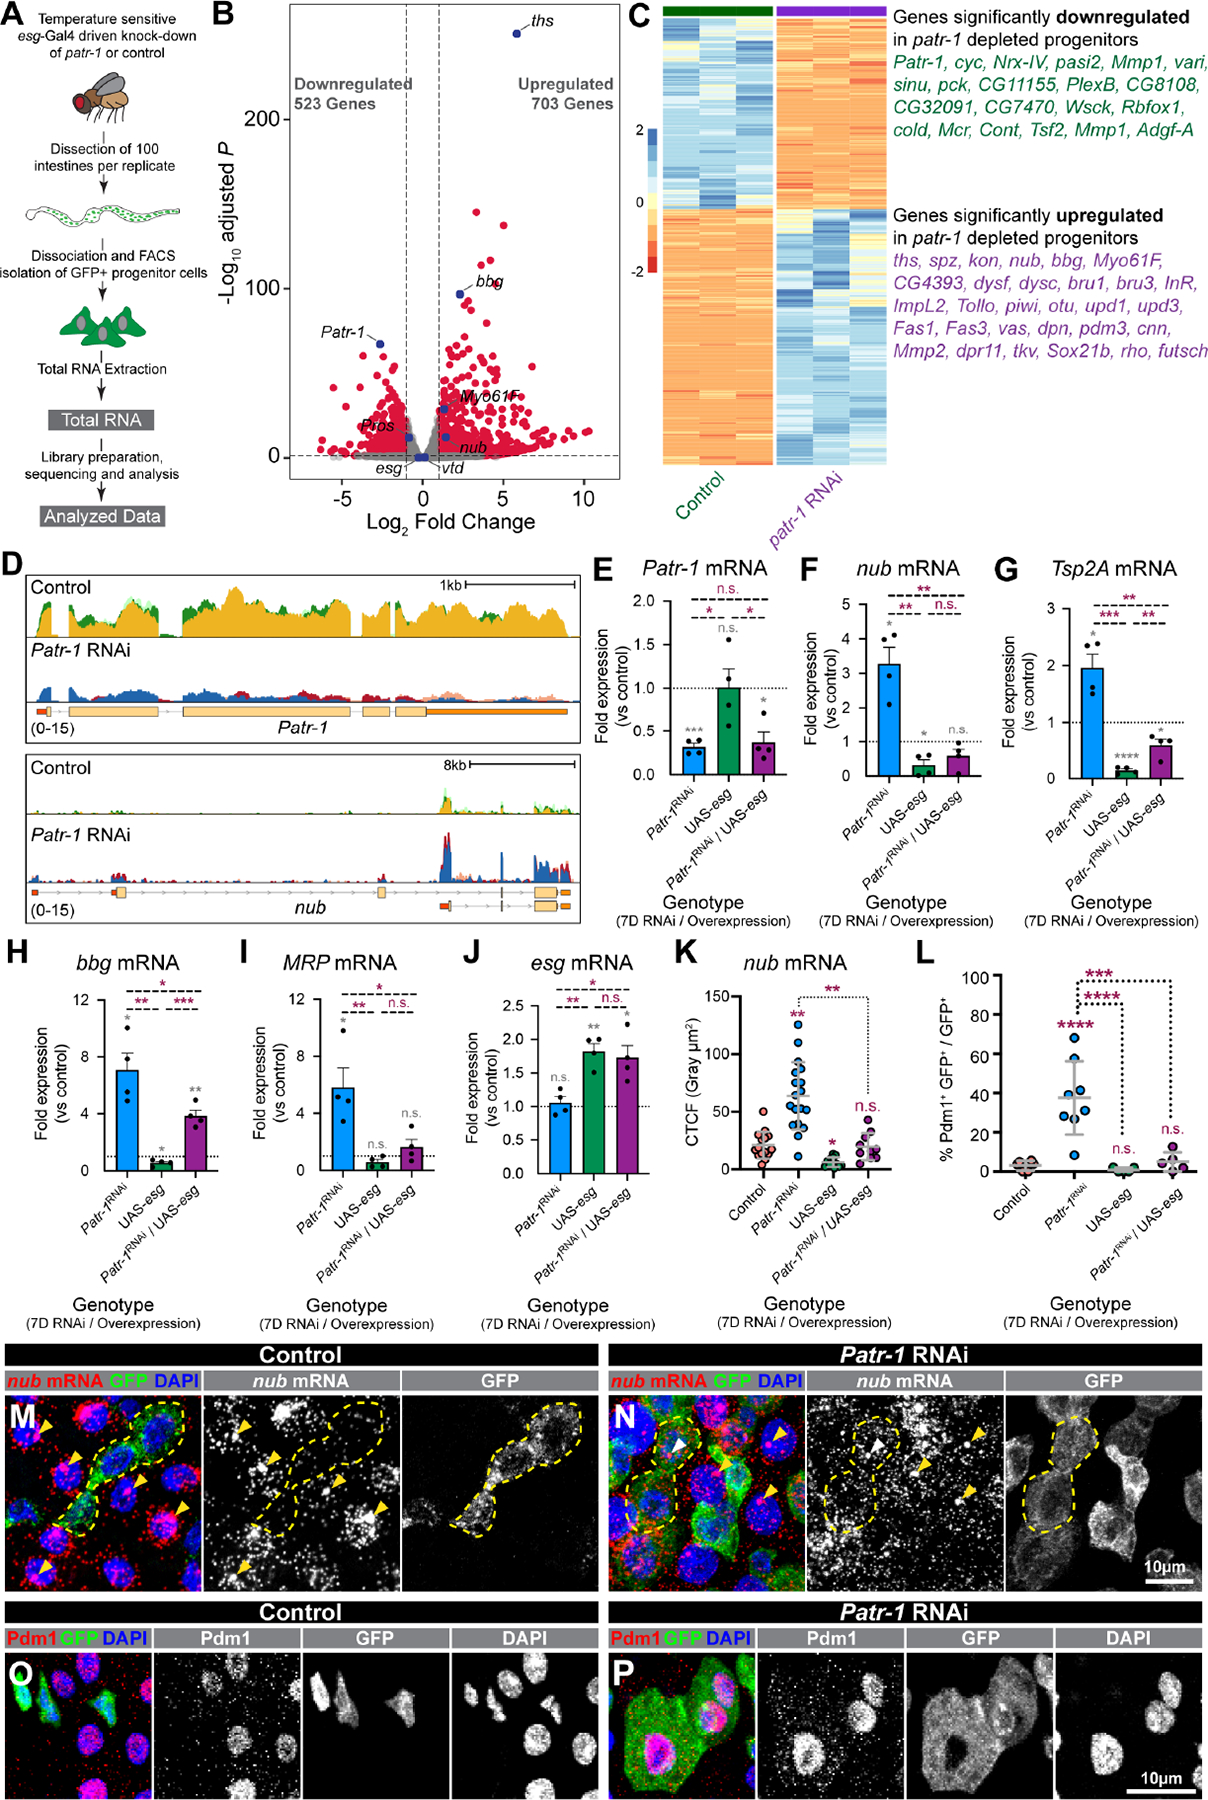
Figure 4. PATR-1 limits pro-differentiation gene expression in intestinal progenitor cells.

(A) Schematic of RNA-seq. (B-C) Volcano plot, heatmap, and selected list of differentially expressed genes in Patr-1 RNAi versus control. (D) CPM-normalized read counts at Patr-1 and nub loci from control and Patr-1 RNAi; replicates are overlayed. (E-J) qPCR levels of Patr-1, nub, Tsp2A, bbg, MRP, and esg mRNA in intestinal progenitors from indicated genotypes compared to control. (K) Normalized nub mRNA fluorescence intensity in progenitor cells of indicated genotypes (n=15, 19, 12, or 10 cells) (L) Percentage of intestinal progenitors with nuclear Pdm1 staining from indicated genotypes (n=6, 8, 5, or 5) after 7 days at 29°C. (M-P) Intestinal progenitors (outlined in yellow) from esgTS or esgTS/Patr-1 RNAi stained for GFP (green), DAPI (blue), and either nub mRNA (red) or Pdm1 (red). Yellow/white arrowheads indicate putative sites of active transcription in ECs/progenitors. Error bars show mean±s.d. and asterisks denote statistical significance from one sample t (E-J, grey), Unpaired t-test (E-J, purple), Kruskal-Wallis test (K) or ordinary one-way ANOVA with Turkey’s multiple comparison test (L). Full genotypes listed in Data S1F. See also Figure S4.
