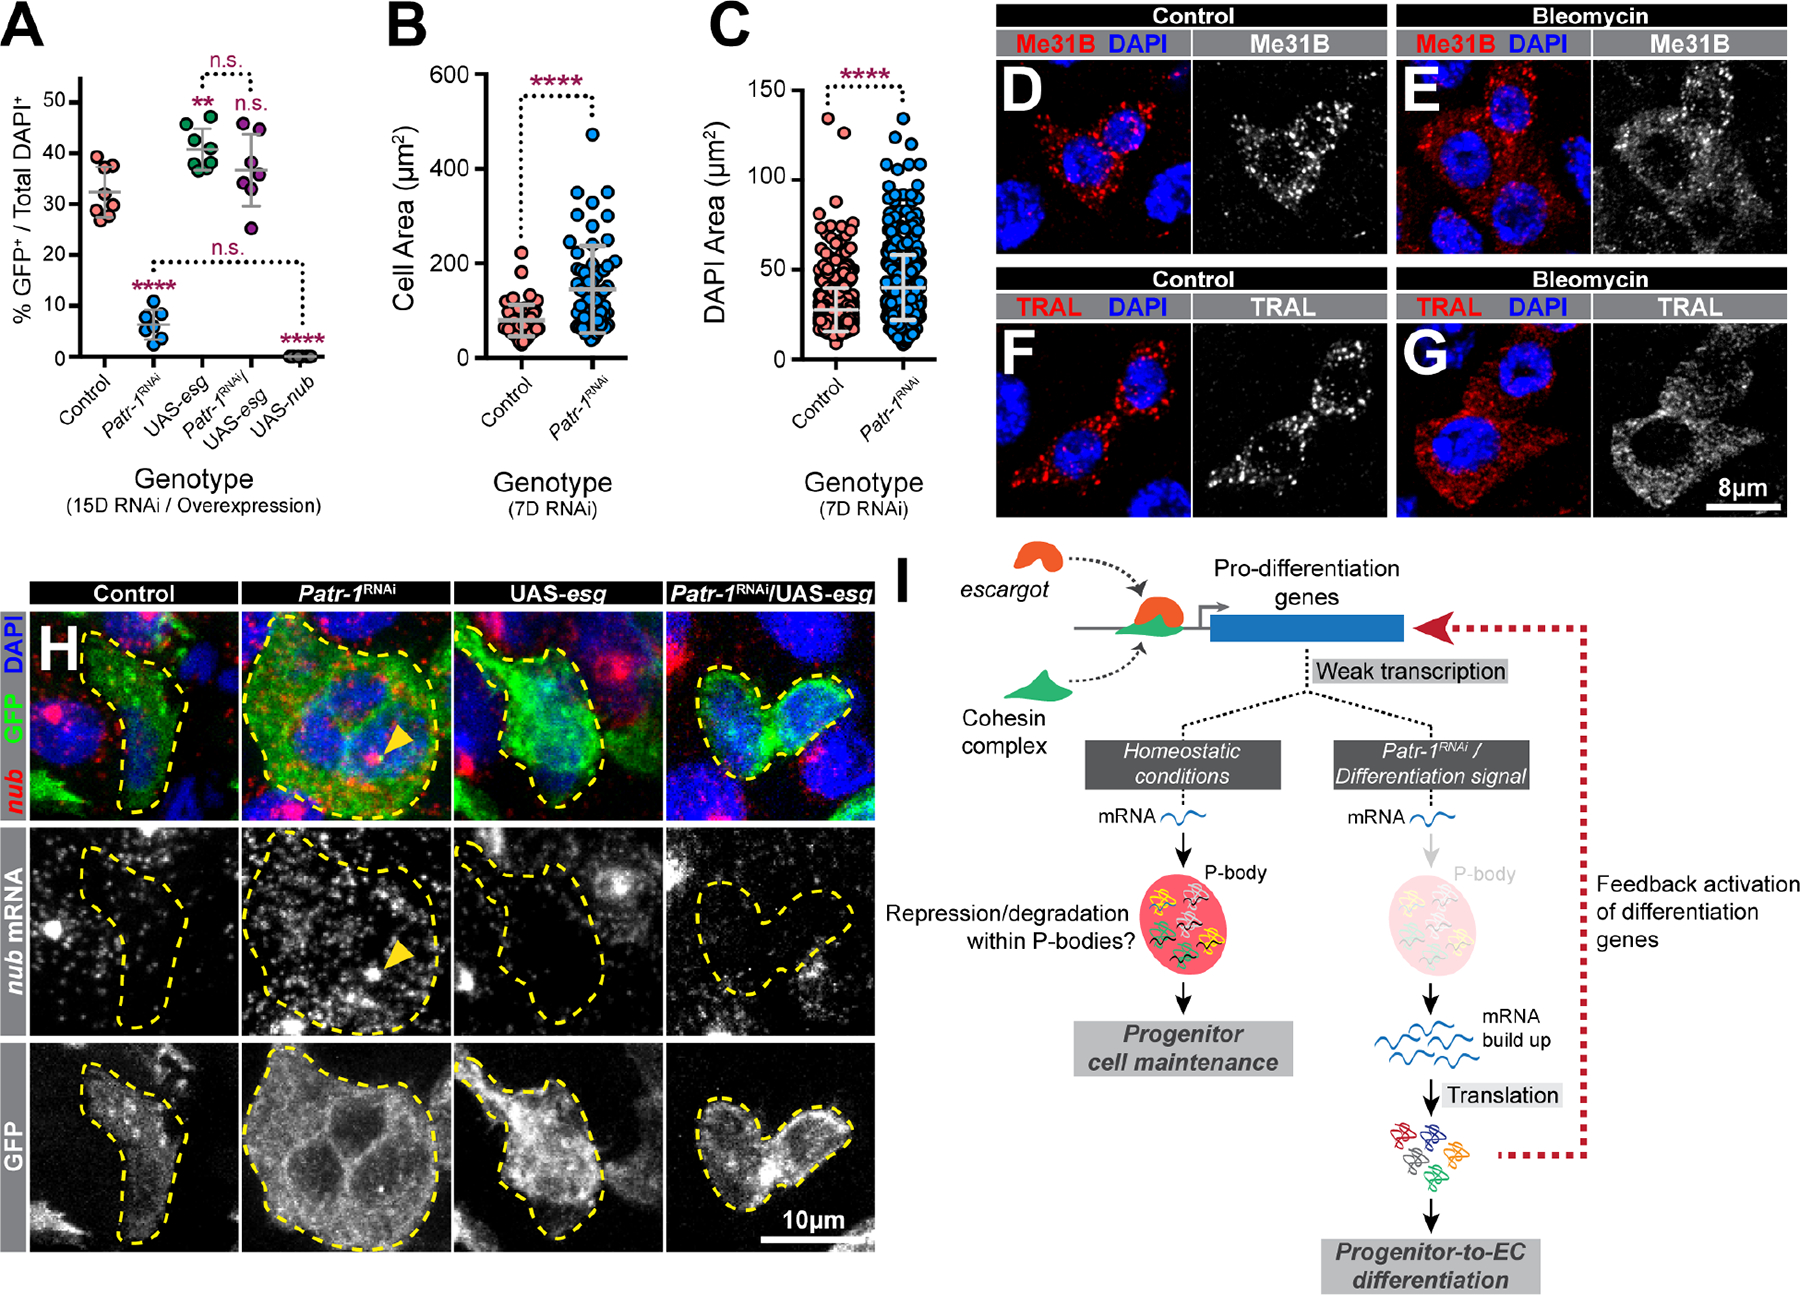
Figure 5. Loss of PATR-1 promotes progenitor-to-EC-differentiation.

(A) Percentages of progenitor cells in PMGs of indicated genotypes (n=8, 7, 8, 7, or 8). (B-C) Cell or nuclear area of intestinal progenitor cells from esgTS or esgTS / Patr-1 RNAi intestines. (D-G) Progenitor cells from flies fed 5% sucrose (control) or 5% sucrose plus 25 μg/ml bleomycin (bleomycin) stained for DAPI (blue) and Me31B (red) or TRAL (red). (H) Intestinal progenitors (outlined) from indicated genotypes stained for nub mRNA (red), GFP (green) and DAPI (blue). Yellow arrowheads indicate putative sites of active transcription. (I) Model. Error bars on plots show mean±s.d. and asterisks denote statistical significance from Ordinary one-way ANOVA with Turkey’s multiple comparison test (A) or Mann-Whitney test (B-C). Full genotypes listed in Data S1F. See also Figure S5.
