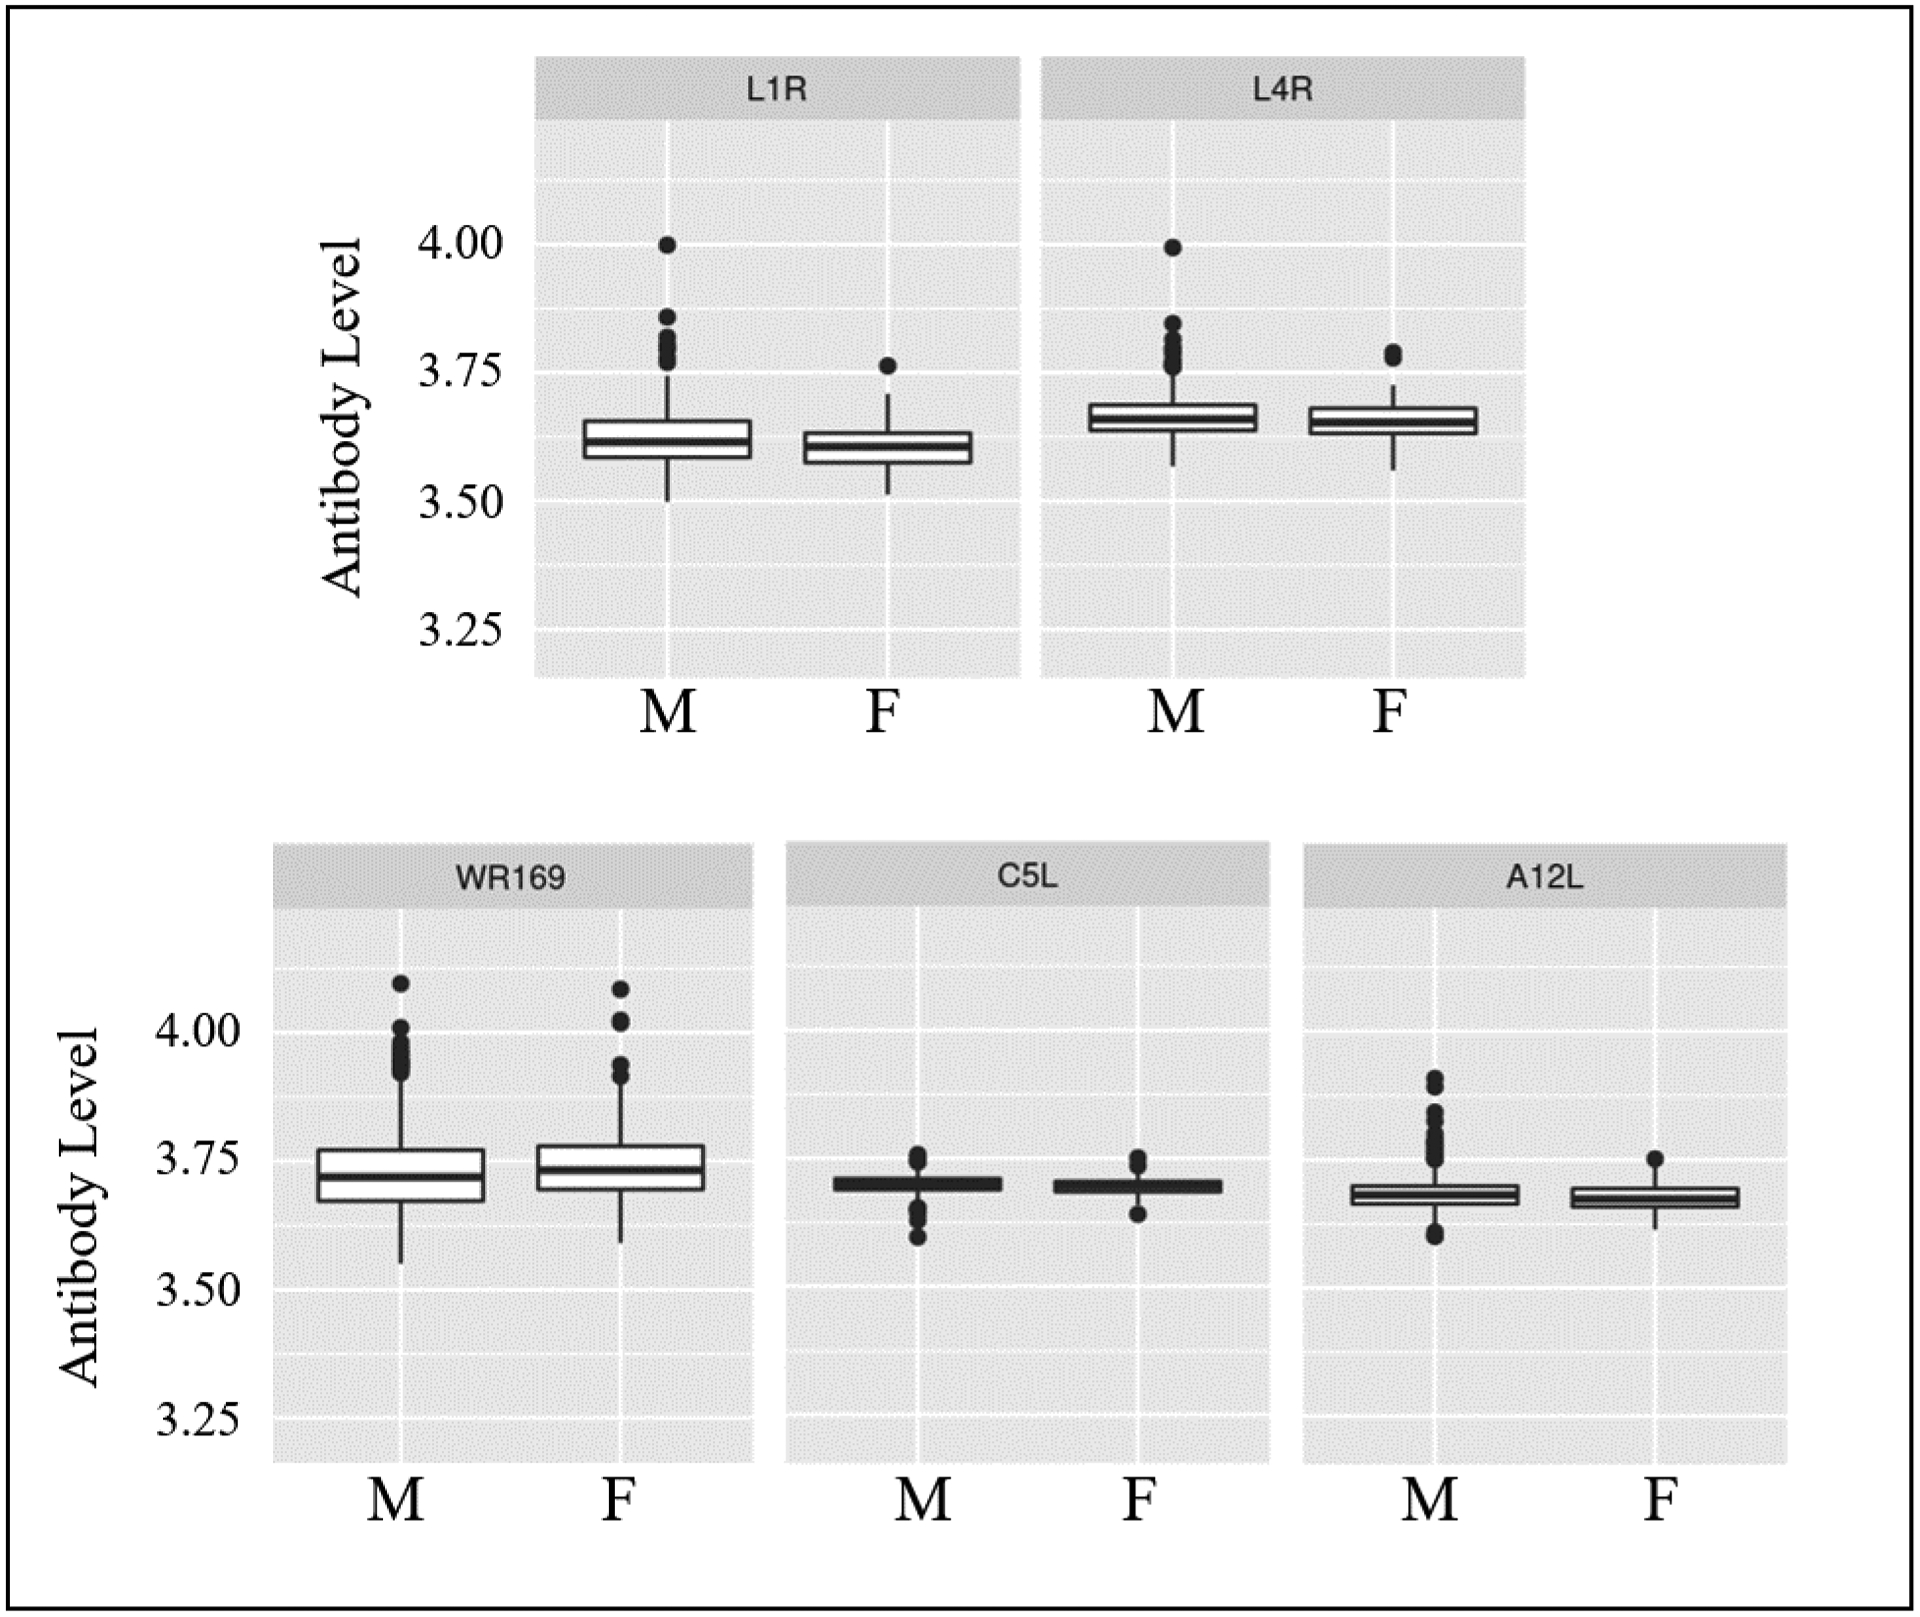
Figure 3. Sex Specific Differences in Antibody Response.

Median normalized antibody measurements for each protein (log2 scale) are provided in the box and whisker plots. M = male, F = female. p-values calculated using the Welch Two Sample t-test.

Median normalized antibody measurements for each protein (log2 scale) are provided in the box and whisker plots. M = male, F = female. p-values calculated using the Welch Two Sample t-test.