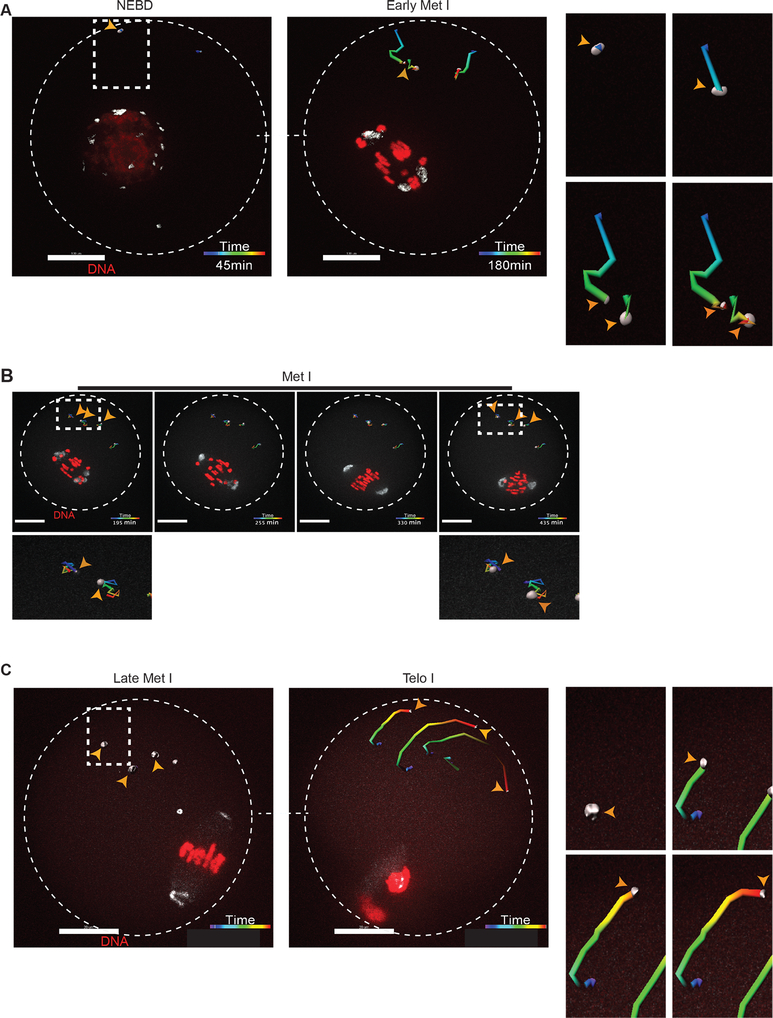
Figure 2: mcMTOCs exhibit three different directional behaviors during meiosis I.
Tracking of 3D reconstructed mcMTOCs from time-lapse confocal microscopy in live oocytes during three different phases: (A) nuclear envelope breakdown (NEBD)- early metaphase I (Met I), (B) Met I and (C) late Met I- telophase I (Telo I). Full-grown prophase-I oocytes were injected with cRNAs encoding H2b-mCherry (red) and Aurka-Gfp (pseudo white), incubated in milrinone-containing CZB medium for 3 h prior to in vitro maturation. Shown are representative images of 3D reconstructed Z-projection of 16 sections every 3 μm from a time course. Fluorescence images were captured every 15 min (time, h:min). The scale bar represents 20 μm (zoomed panels, 5 μm). Right panels show a zoomed area of mcMTOC tracking over time (See Video S3). The overall direction of displacement was calculated automatically by Bitplane Imaris software. Arrowheads represent mcMTOCs. The total number of analyzed oocytes is 60.

