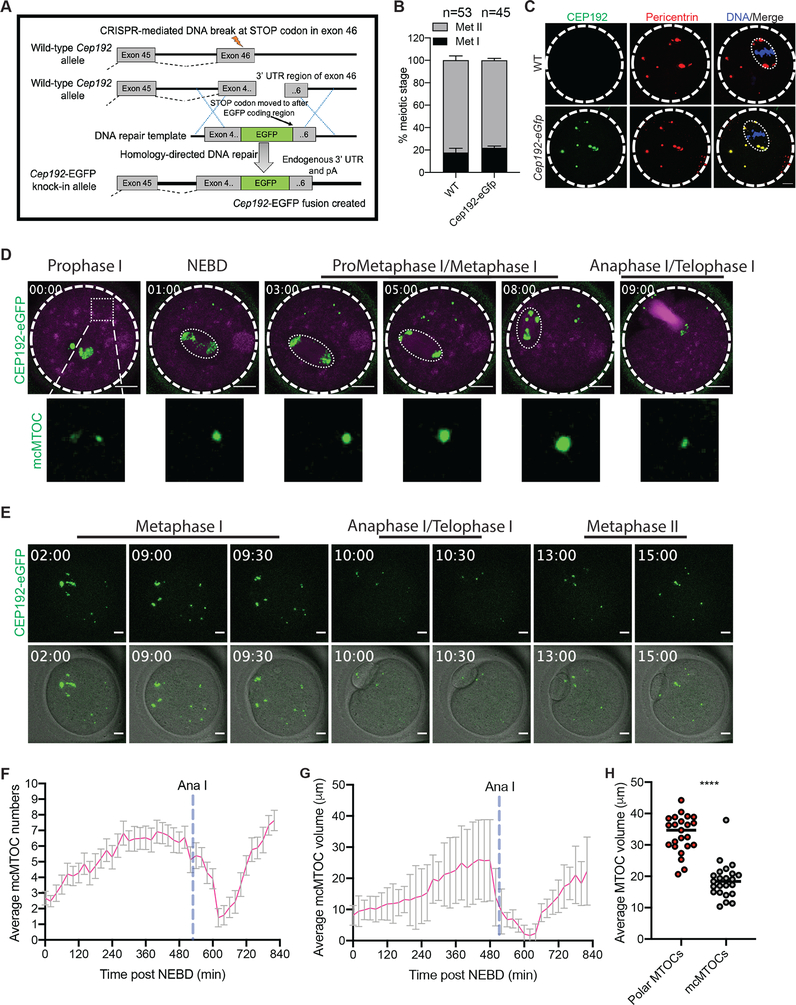
Figure 3: Determining the behavior of endogenously labeled mcMTOCs during meiosis I.
(A) Diagram for generating Cep192-eGfp reporter mice. (B) Full-grown prophase I-arrested oocytes were collected from wild-type (WT) and Cep192-eGfp reporter mice, in vitro matured for 16 h (Met II) and assessed for meiotic progression. (C) Full-grown prophase I-arrested oocytes were collected from Cep192-eGfp reporter mice (CEP192 MTOCs are labeled green) and in vitro matured for 7 h. Metaphase I oocytes were fixed and immunostained using pericentrin antibody to label MTOCs (red). DAPI was used to detect DNA (blue). Arrowheads represent colocalized CEP192 with pericentrin at mcMTOCs. Shown are representative Z-projection images. Scale bars represent 10 μm. (D) Representative images (Z-projection of 13 sections every 5 μm) of time-lapse confocal microscopy of a live Cep192-eGfp oocyte incubated with SiR-tubulin from a time course (see Video S4). Fluorescence images (lower panels) were captured every 30 min post NEBD (time, h:min). Scale bars represent 20 μm (zoomed panels, 2 μm). (E) Representative images (Z-projection of 13 sections every 5 μm) of time-lapse confocal microscopy of a live Cep192-eGfp oocyte from a time course (see Video S4). Fluorescence and bright-field images (lower panels) were captured every 30 min post NEBD (time, h:min). Scale bars represent 10 μm. (F,G) Quantification of average MTOC number and MTOC volume over time in Cep192-eGfp oocyte during meiosis I, respectively. Error bars show S.D. Dashed blue lines represent the time of Anaphase I onset. (H). Quantification of average mcMTOC and polar MTOC volume during metaphase I (Met I). The data are expressed as mean ± SEM. Student t-test was used to analyze the data. Values with asterisks vary significantly, ****P < 0.0001.

