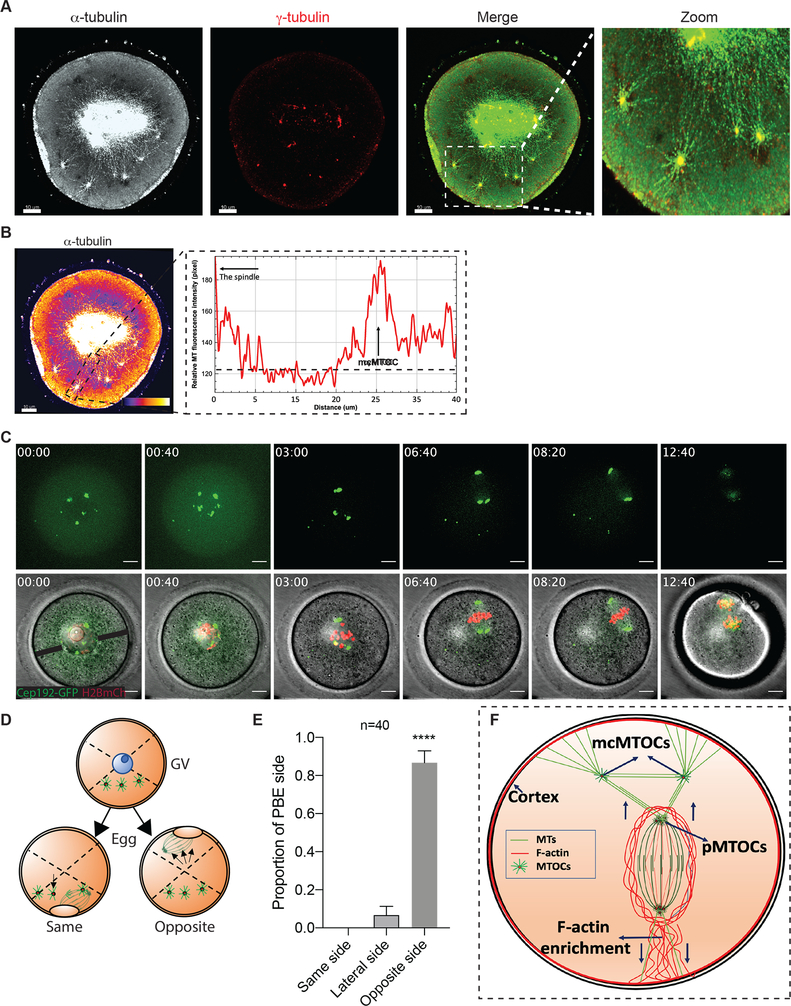
Figure 4: mcMTOCs anchor the spindle to the cortex.
(A) Fully grown prophase-I-arrested oocytes were in vitro matured for 6 h (metaphase I) prior to fixation and immunocytochemistry using γ-tubulin and α-tubulin antibodies to label MTOCs (red) and microtubules (pseudo grey). Hoechst was used to detect DNA (blue). Fluorescence signals were detected under a 63X objective using STED super-resolution system. Shown is a representative image (Z-projection of 65 sections every 0.5 μm). (B) Example of fluorescence intensity of microtubules connecting pMTOCs, mcMTOCs and the cortex, using the ‘plot profiles’ function in ImageJ. The scale bar represents 10 μm. (C) Representative images (Z-projection of 16 sections every 3 μm) of time-lapse confocal microscopy of a live oocyte expressing AURKA-GFP (MTOCs) and H2B-mCherry (chromosomes) from a time course (see Video S5). Fluorescence and bright-field images (lower panels) were captured every 20 min (time, h:min). Arrowheads represent mcMTOCs. Scale bars represent 10 μm. (D) Schematic diagram shows how the proportion of polar body extrusion side in relation to mcMTOC position was assessed. (E) Quantification of the proportion of polar body extrusion side from “C” according to “D”. (F) Schematic model for spindle positioning in the meiotic oocyte. The data are expressed as mean ± SEM. Student t-test was used to analyze the data. Values with asterisks vary significantly, ****P < 0.0001. The total number of analyzed oocytes (from three independent replicates) is specified above the graph.

