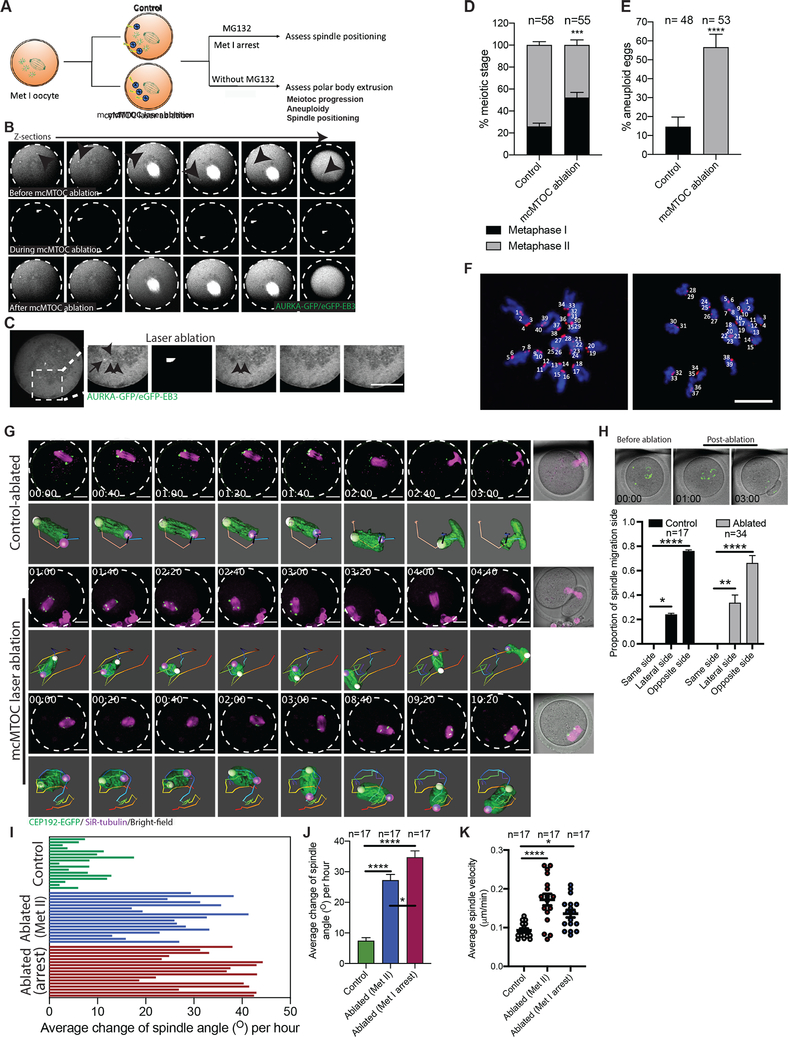
Figure 5: mcMTOCs are required to regulate spindle positioning in meiotic oocytes.
(A) Schematic diagram shows the experimental design following mcMTOC depletion. (B,C) Oocytes expressing AURKA-GFP and eGFP-EB3 were in vitro maturated for 6 h (metaphase I, Met I), transferred to CZB medium with MG-132, followed by mcMTOC depletion using two-photon laser ablation. Small square area(s) surrounding mcMTOCs were marked and then exposed to a laser with 925 nm wavelength. Control oocytes were exposed to the same parameters except ablating random areas of the cytoplasm equal to the same size and number of mcMTOCs. (B) Z-sections of 3D time-lapse imaging of a live oocyte during mcMTOC ablation (see Video S6). Black arrowheads represent mcMTOCs before ablation (upper panels). White arrowheads represent laser beam targets (middle panels). (C) Z-sections of 3D time-lapse imaging of live oocyte to track microtubules (eGFP-EB3) following mcMTOC ablation. Black arrow represents an mcMTOC before ablation (−3 S). Black arrowheads track microtubules over time. The scale bar represents 20 μm. (D-J) Control and mcMTOC-depleted Cep192-eGfp oocytes were in vitro matured in MG-132-free medium until Met II (16 h) and assessed for meiotic progression (D) and aneuploidy (E). (F) Control-ablated and mcMTOC-ablated Met II oocytes were treated with monastrol followed by immunocytochemistry to label kinetochores with CREST anti-sera (red). DNA was stained with DAPI (blue). Kinetochore numbers were counted in each oocyte in serial confocal sections, and an aberration of 40 was scored as aneuploid. Shown are representative Z-projections. Scale bars represent 10 μm. (G) Representative Z-projection of the spindle from time-lapse confocal imaging (14 sections every 5 μm) of mcMTOC-ablated and control-ablated Cep192-eGfp oocytes (MTOCs are labeled green) in vitro matured in MG-132-free medium with SiR-tubulin (to label microtubules, magenta). Time-lapse imaging started 1 h post laser ablation. Scale bars represent 20 μm. (H) Quantification of the proportion of spindle migration side following laser ablation. (I) Quantification of the average change of spindle orientation angle per oocyte. Each bar represents an oocyte. (J) Quantification of the average change of spindle orientation angle per experimental group. (K) Quantification of average spindle velocity during migration until reaching the nearest point to the cortex. The data are expressed as mean ± SEM. Chi-square contingency test (D,E) and One-way ANOVA (H,J,K) was used to analyze the data. Values with asterisks vary significantly, *P < 0.05, ***P < 0.001, ****P < 0.0001. The total number of analyzed oocytes (from three independent replicates) is specified above each graph.

