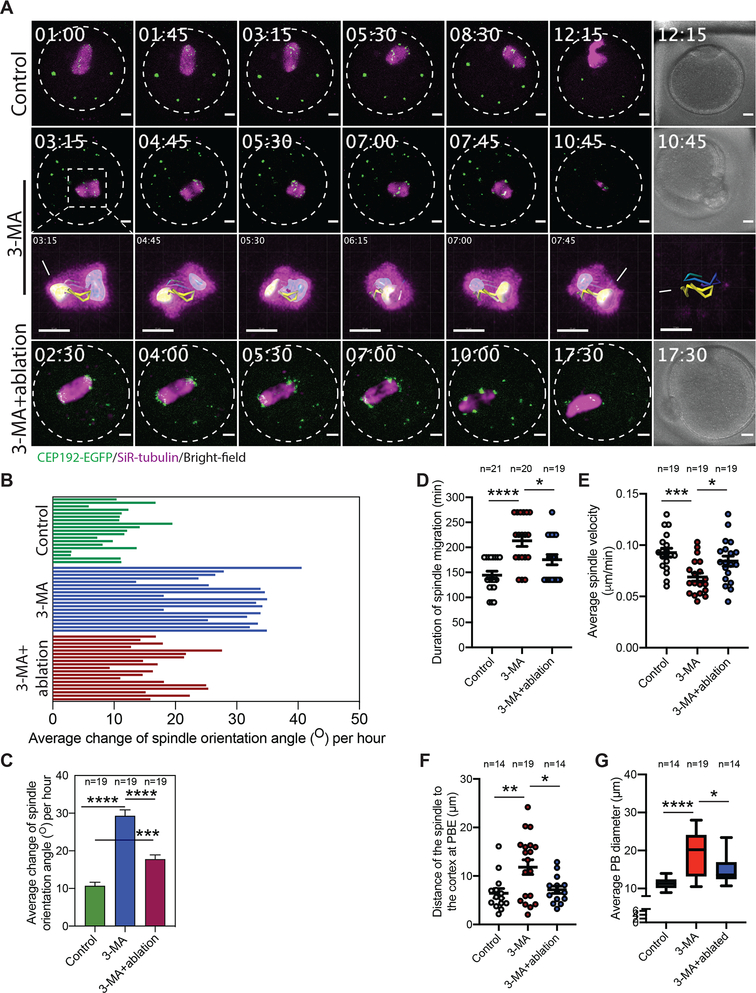
Figure 6: mcMTOC numbers are critical for spindle positioning and timely spindle migration in meiotic oocytes.
(A) Z-projection (13 sections every 5 μm) of time-lapse confocal imaging of Cep192-eGfp oocytes (MTOCs are labeled green) in vitro matured with SiR-tubulin and DMSO (control), 3-MA or 3-MA+laser ablation (6 mcMTOCs were depleted, see Supplementary Fig. 6). Time-lapse imaging started 1 h post laser ablation. White arrows and asterisks indicate the two spindle poles. Scale bars represent 10 μm. (B) Quantification of the average change of spindle orientation angle per oocyte. Each bar represents an oocyte. (C) Quantification of the average change of spindle orientation angle per experimental group. (D) Quantification of the time spent by the spindle during its migration until reaching the nearest point to the cortex. (E) Quantification of average spindle velocity during migration until reaching the nearest point to the cortex. (F) Quantification of distance of the spindle to the nearest cortex at anaphase I. (G) Quantification of average polar body diameter. Scale bars represent 10 μm. The data are expressed as mean ± SEM. One-way ANOVA was used to analyze the data. Values with asterisks vary significantly, *P < 0.05, **P < 0.01, ***P < 0.001, ****P < 0.0001. The total number of analyzed oocytes (from three independent replicates) is specified above each graph.

