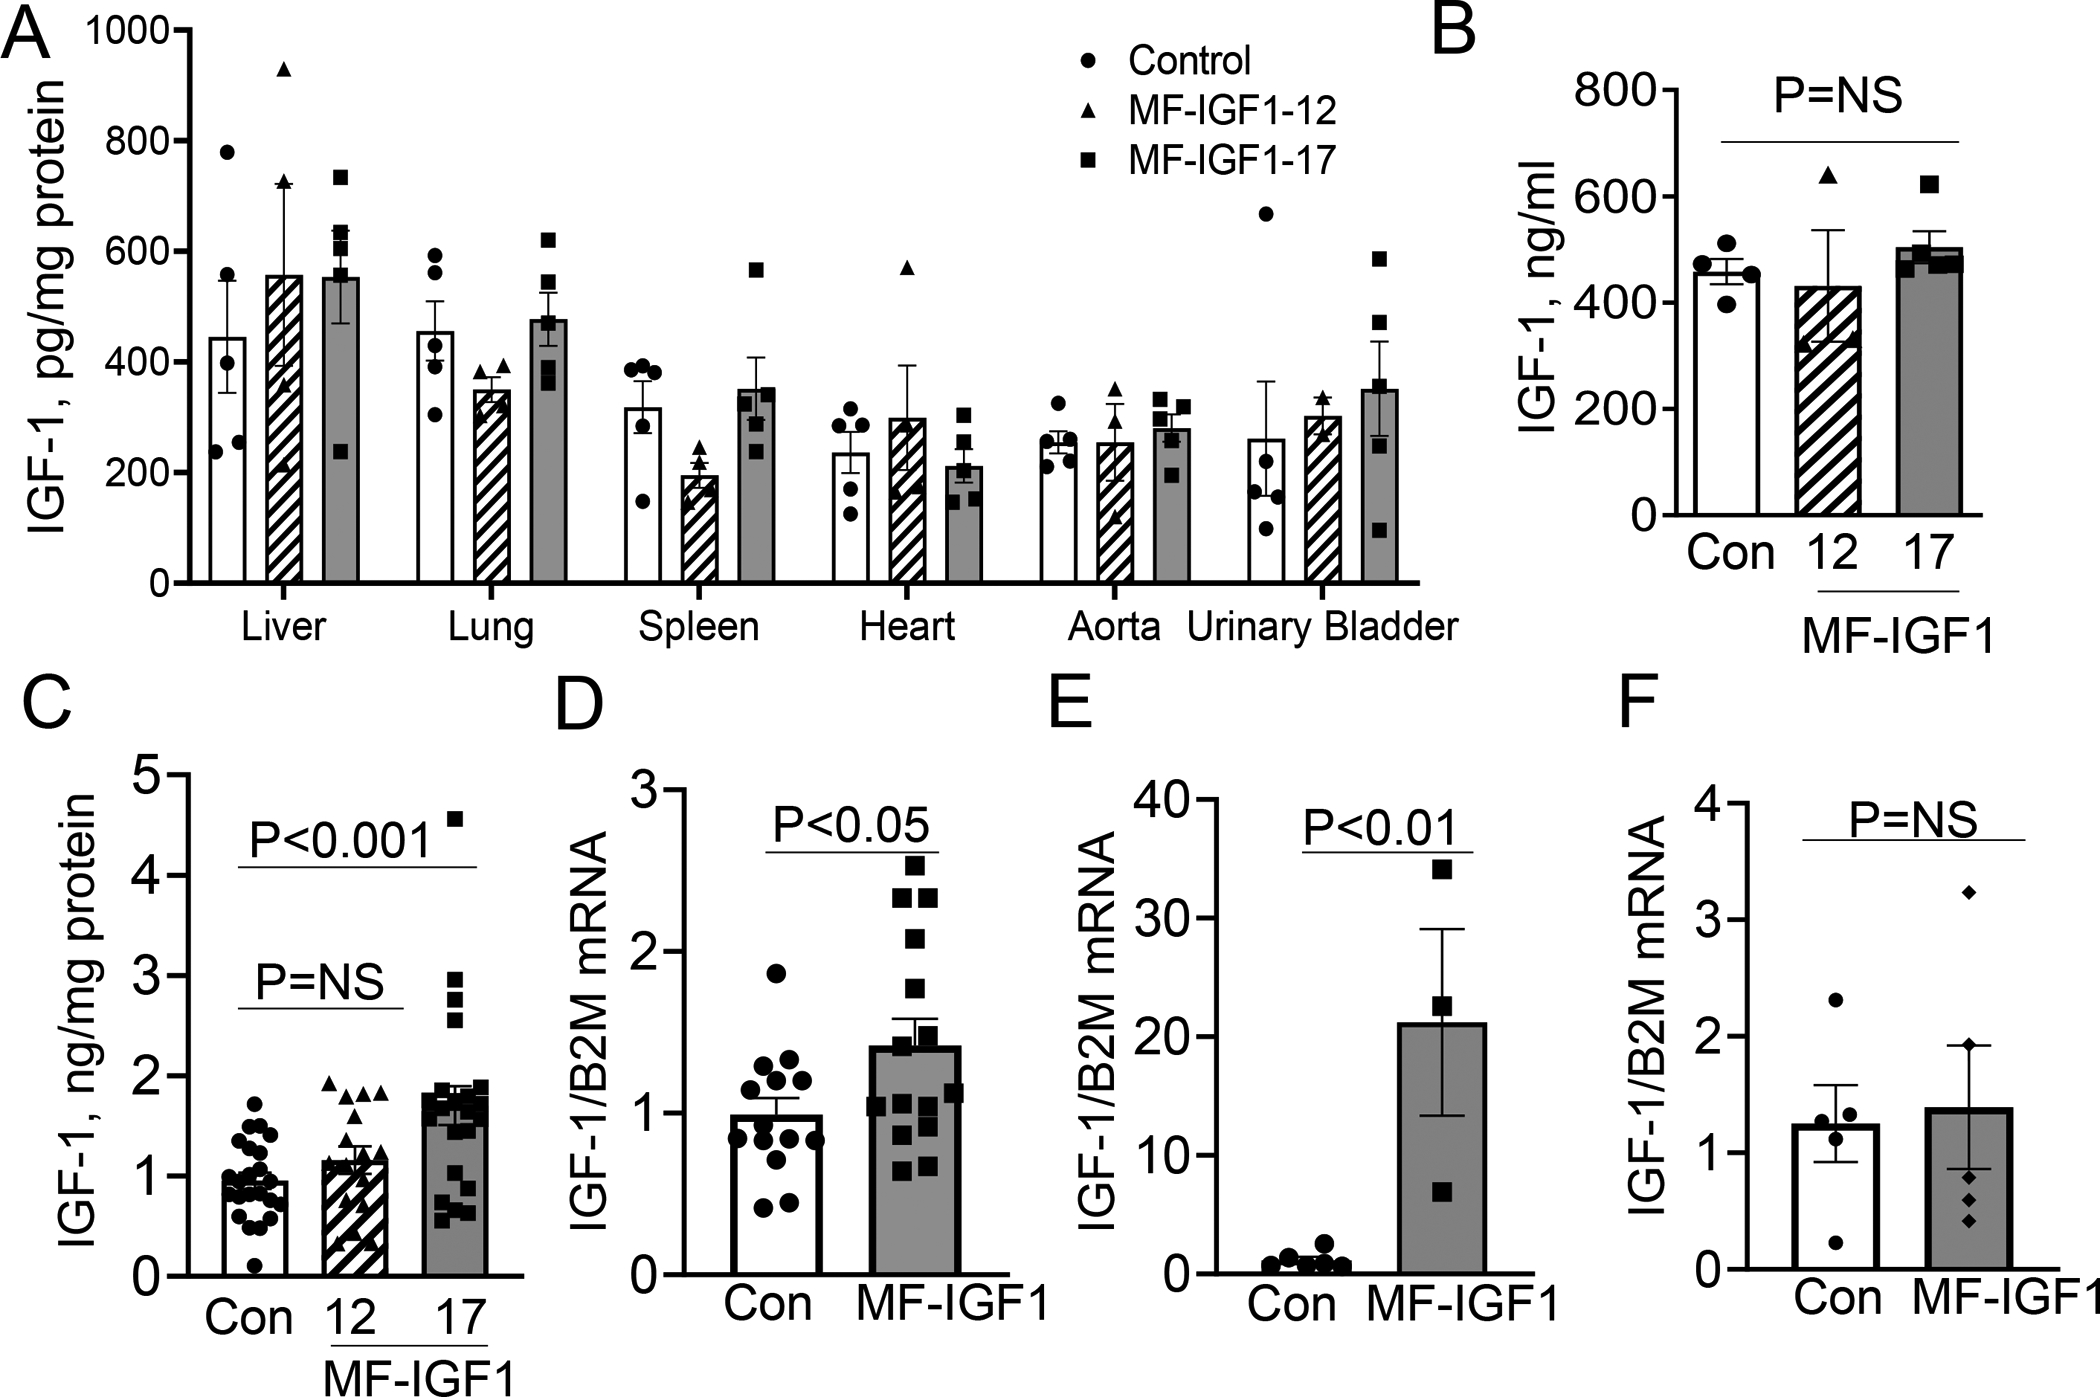
Figure 1: Macrophage-specific IGF-1 overexpressing mice.

A. IGF-1 protein isolated from mice with macrophage-specific IGF-1 overexpression (#12 and #17 mice) and control (Apoe−/− mice) (N=4– 5 mice per group) showing no significant difference in any tissue. B. Serum IGF-1 levels measured by ELISA (N=4–5 mice per group). C. IGF-1 levels in conditioned media of peritoneal macrophages (N=22–25 mice per group). IGF-1 levels were normalized to total protein levels. D. IGF-1 mRNA levels in peritoneal macrophages in #17 (MF-IGF1) and control mice after 24 hours in SFM (N=12–14 mice per group). E. IGF-1 mRNA levels in plaque samples isolated by LCM in #17 (MF-IGF1) and control mice (N=3–6 mice per group). F. IGF-1 mRNA levels in circulating CD11b+/F4/80+ monocytes (N=5–6 mice per group). A, B, C used one-way ANOVA with a Tukey’s post-hoc test. All other statistical tests are Student’s two-tailed t-test.
