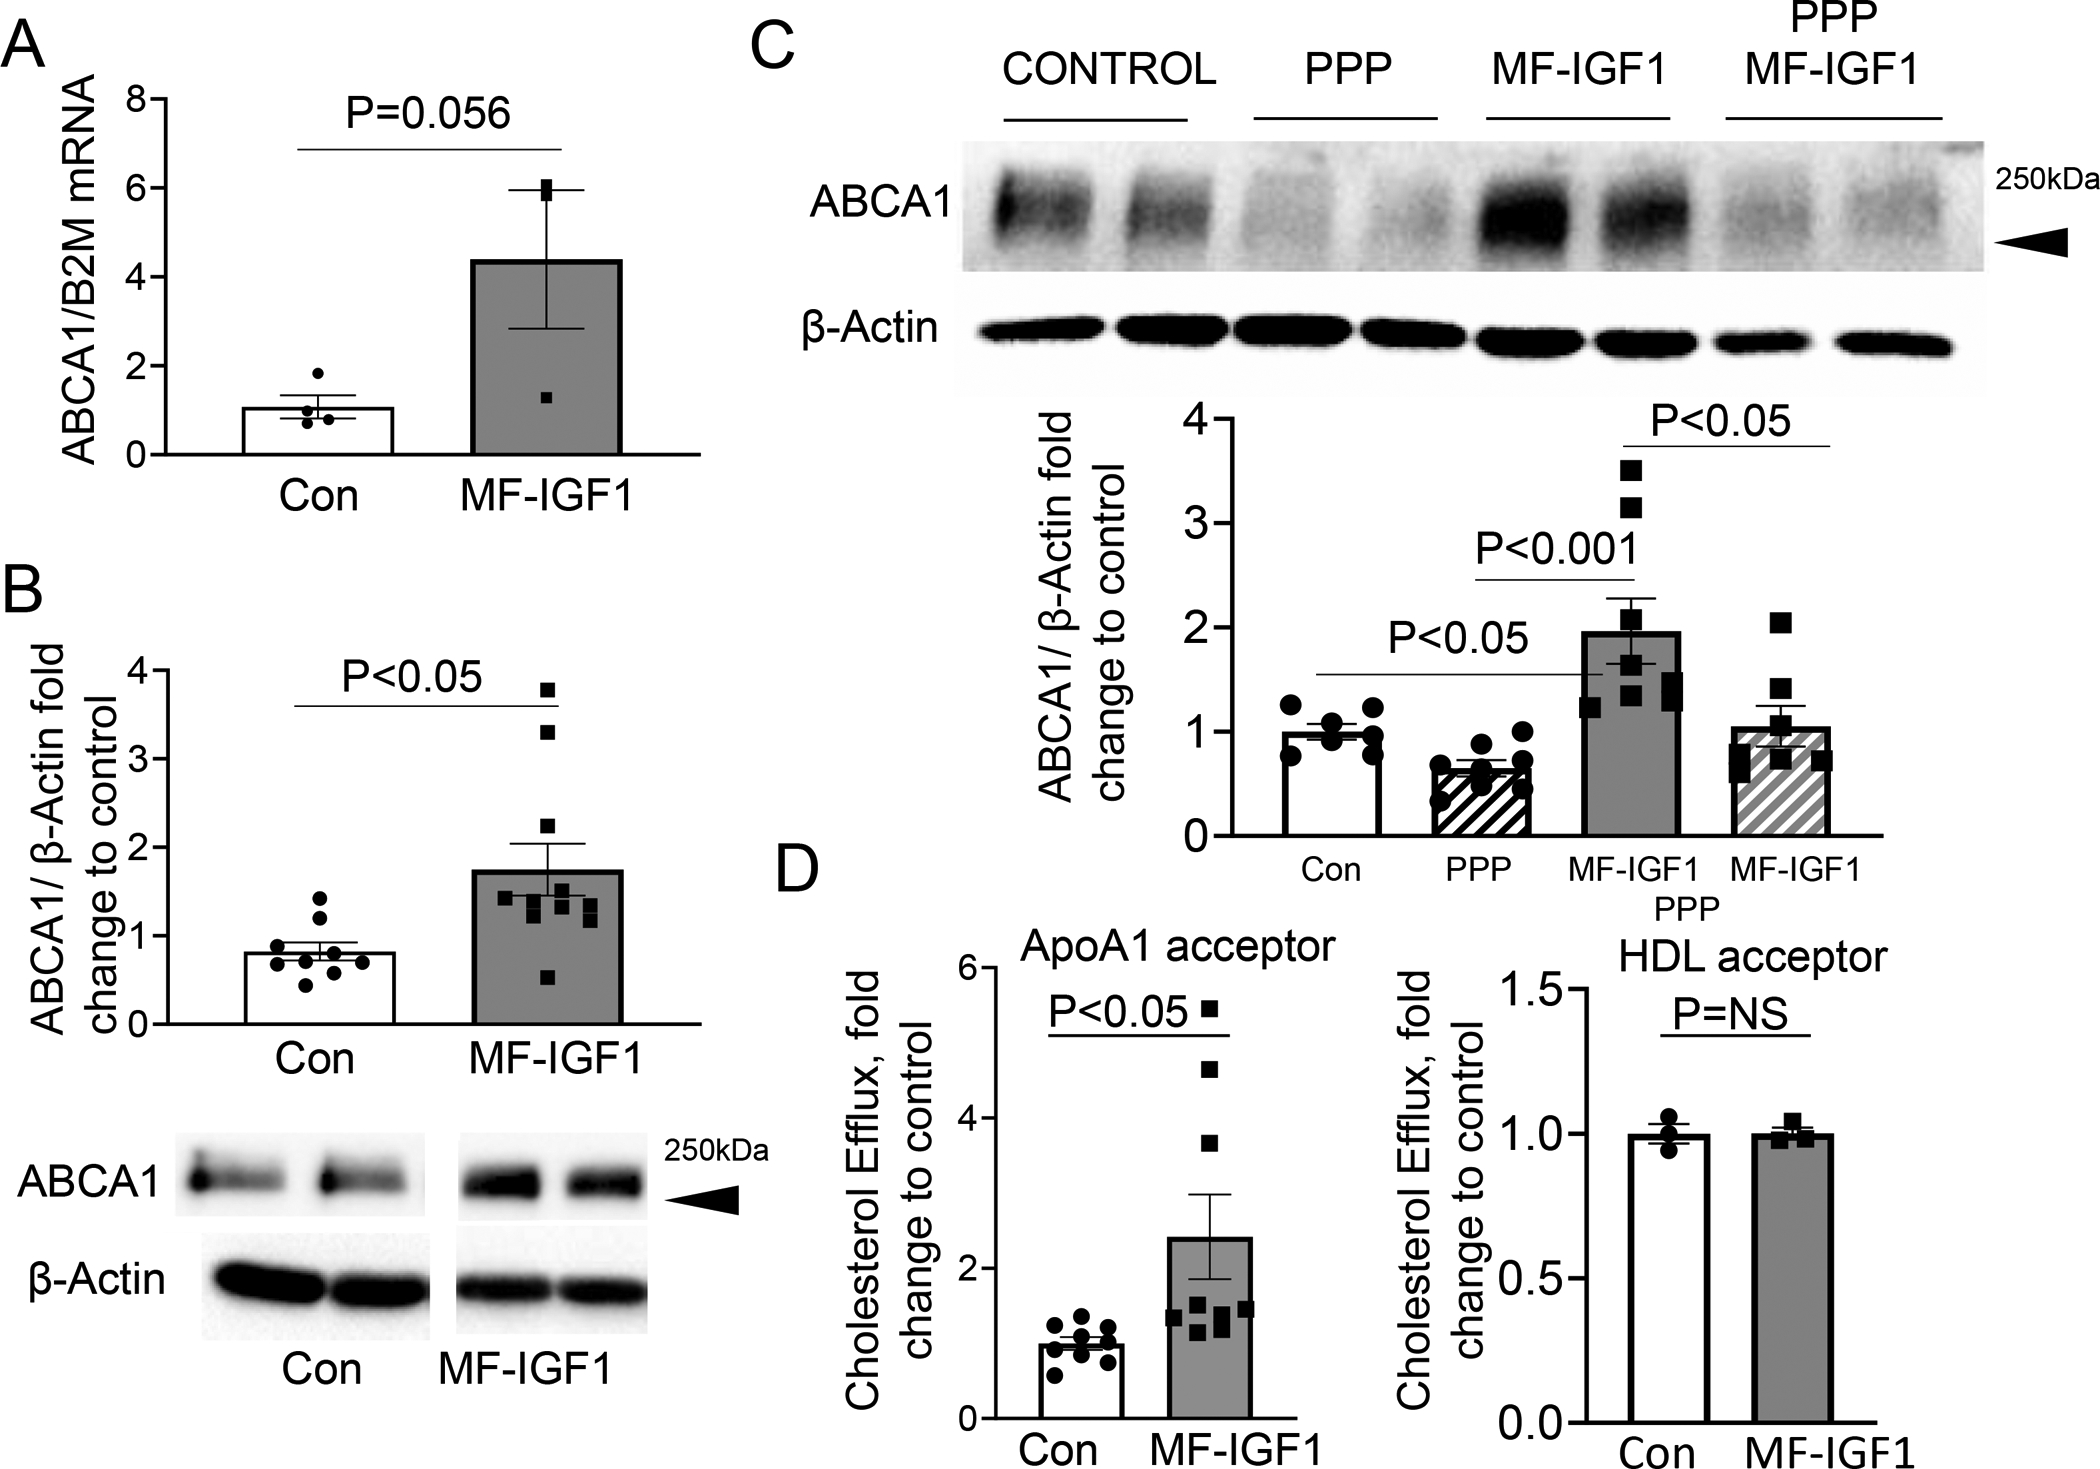
Figure 5: Macrophage-specific IGF-1 overexpression upregulated ABCA1 expression.

A. ABCA1 mRNA levels in LCM plaque isolates (N=3–5 mice per group). B. ABCA1 protein levels in peritoneal macrophages were quantified by immunoblotting. Cells were incubated in SFM for 48 hours. Predicted weight 254 kDa. (N=10–11 mice per group). C. Peritoneal macrophages were pretreated with PPP and ABCA1 protein levels were measured (N=3–4 wells per group in 2 independent experiments). D. Cholesterol efflux assay with ApoAI as an acceptor (N=3 wells per animal, 3 mice in each group) or with HDL as an acceptor. (N=1 well per animal, 3 mice per group). All statistical tests are Student’s two-tailed t-test.
