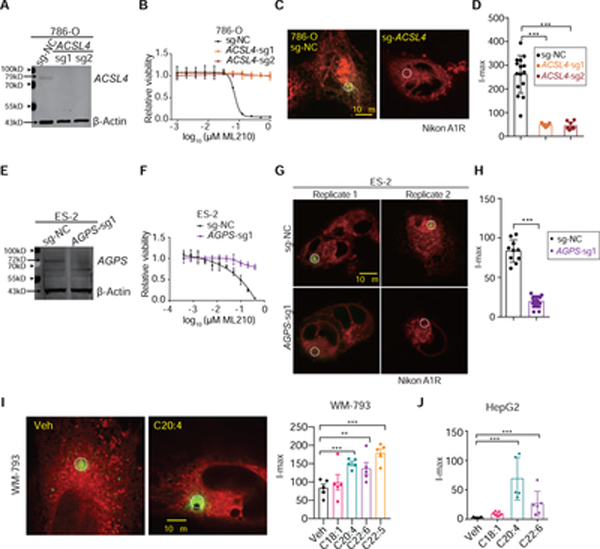
Figure 3. PALPv1-induced fluorescence is dependent on membrane polyunsaturated phospholipid levels.
A. Immunoblot analysis of ACSL4 protein levels in 786-O cells expressing non-targeting negative control sgRNA (sg-NC) or ACSL4-targeting sgRNAs. β-Actin was used as a loading control. This experiment was repeated twice.
B. Viability curves of 786-O cells expressing sg-NC or sgRNAs targeting ACSL4 treated with indicated concentrations of GPX4 inhibitor ML210 for 48h. n=6; dots and error bars, mean±s.d. This experiment was repeated three times.
C. Representative fluorescent images showing the I-max (0 sec) post the application of 405 nm laser pulses to 786-O cells expressing sg-NC or ACSL4-targeting sgRNA. Green, oxidized BODIPY-C11 signal; red, reduced BODIPY-C11 signal. Representative images from three independent experiments.
D. Quantifications of the I-max fluorescence intensities in sgNC or ACSL4-sgRNA expressing 786-O cells. Dots and error bars, mean±s.d. Statistical analysis was performed using two-tailed unpaired student’s T-test. ***, p<0.001.
E. Immunoblot analysis of AGPS protein levels in ES-2 cells expressing sg-NC or AGPS-targeting sgRNAs. β-Actin was used as a loading control. This experiment was performed once, and the efficacy of the sgRNA was previously validated (Zou et al., 2020b).
F. Viability curves of ES-2 cells expressing sg-NC or sgRNAs targeting AGPS treated with indicated concentrations of GPX4 inhibitor ML210 for 48h. n=6; error bar, mean±s.d. This experiment was repeated twice.
G. Representative fluorescent images showing the I-max (0 sec) post the application of laser pulses to ES-2 cells expressing sg-NC or AGPS-targeting sgRNA. Green, oxidized BODIPY-C11 signal; red, reduced BODIPY-C11 signal. This experiment was performed once and 5 different cells were targeted and analyzed for each group.
H. Box-scatter plots showing the I-max of PALP signals in WM-793 melanoma cells treated with vehicle (veh) or indicated free fatty acids at 20 μM concentration for 3 days. Dots and error bars, mean±s.d. Statistical analysis was performed using two-tailed unpaired T-test, ***, p<0.001.
I. Representative fluorescent images showing the I-max (0 sec) post the application of laser pulses to WM-793 cells treated with vehicle (Veh, 5% BSA) or BSA conjugated arachidonic acid (C20:4). Scale bar indicates 10 μm. Green, oxidized BODIPY-C11 signal; red, reduced BODIPY-C11 signal. Dots and error bars, mean±s.d. Statistical analysis was performed using two-tailed unpaired T-test, **, p<0.01, ***, p<0.001. Representative results from three independent experiments.
J. Box-scatter plots showing the I-max of PALP signals in HepG2 hepatoma cells pretreated with vehicle (veh) or indicated free fatty acids at 20 μM concentration for 3 days. Dots and error bars, mean±s.d. Statistical analysis was performed using two-tailed unpaired T-test, ***, p<0.001.

