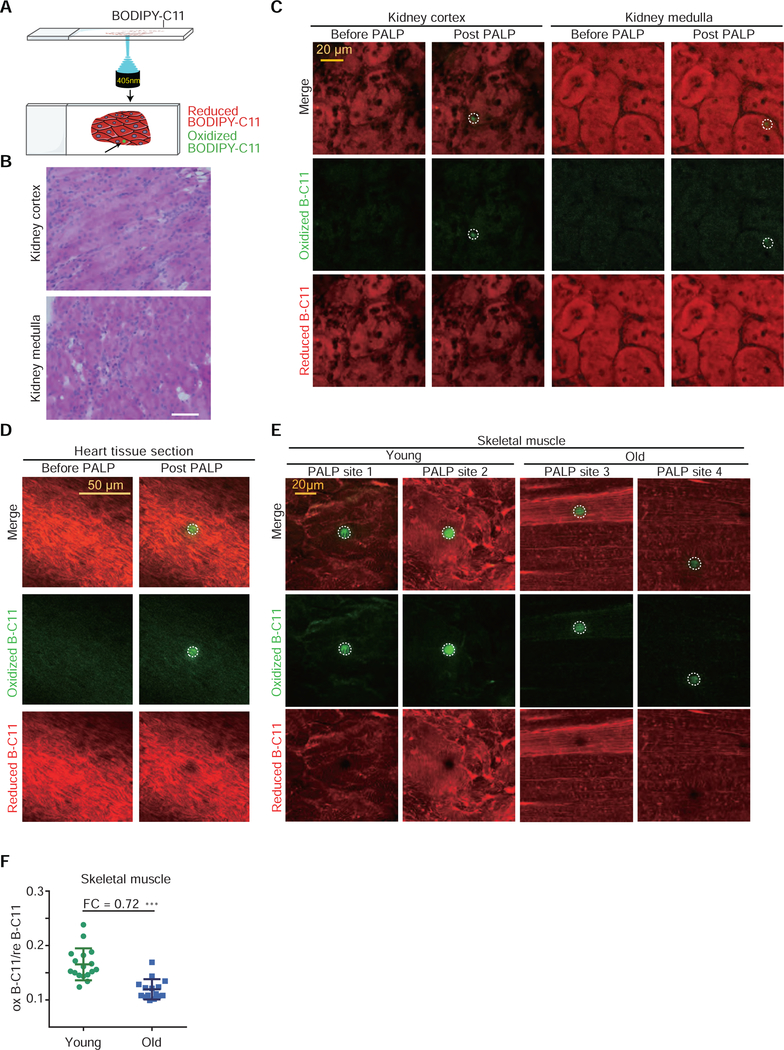
Figure 5. PALPv1 enables detection of polyunsaturated phospholipids in multiple tissues in situ.
A. Schematic diagram describing the procedures of PALPv1 technique for tissue sections. BODIPY-C11 at a concentration of 5 μM was added to the cells approximately 30 min prior to imaging. Each 405 nm confocal laser was set at zero HV mode and standard gain with 4 loops of 120 ms exposure laser. Scan speed was set at 8 Fps and pixel dwell was 11.6. The 488 nm channel intensity was then recorded for the oxidized BODIPY-C11 signal.
B. Histologic examination of transverse section of mouse kidney cortex and medulla using hematoxylin and eosin (H&E) staining. Original magnification X 400.
C. Representative fluorescent images showing the reduced and oxidized BODIPY-C11 signal before and after the application of 405 nm laser pulses in cryo-sectioned mouse kidney tissue sections. Green, oxidized BODIPY-C11 signal; red, reduced BODIPY-C11 signal. This experiment was performed once and 8 random regions were targeted and analyzed for either the kidney cortex or medulla.
D. Representative fluorescent images showing the reduced and oxidized BODIPY-C11 signal before and after the application of 405 nm laser pulses in cryo-sectioned mouse heart tissue sections. This experiment was performed once and 5 random regions were targeted and analyzed.
E. Representative fluorescent images showing the reduced and oxidized BODIPY-C11 signal before and after the application of 405 nm laser pulses in cryo-sectioned skeletal muscle tissue sections from young and old mice. This experiment was performed once.
F. Scatter plot showing the quantitation of the oxidized/reduced BODIPY-C11 fluorescence in laser stimulated region in the skeletal muscle tissue samples from young and old mice. PALP signal was normalized by the reduced BODIPY-C11 fluorescence prior to laser stimulation. Dots and error bars, mean±s.d. Two-tailed, unpaired student’s T-test. ***, p<0.001. FC, fold-change.

