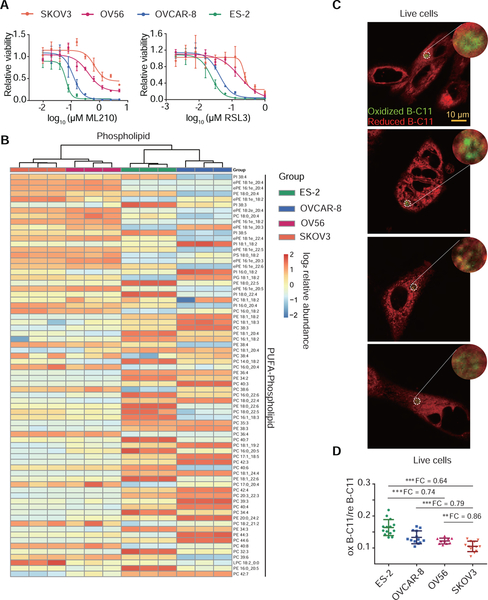
Figure 6. PALPv1 differentiates the differences in ferroptosis sensitivity across a collection of ovarian cancer cell lines in culture.
A. Viability curves of SKOV3, OV56, OVCAR-8, and ES-2 cells treated with indicated concentrations of GPX4 inhibitors ML210 or RSL3 for 48h. n=4; dots and error bars, mean±s.d. Representative results from experiments performed twice.
B. Heatmap presentation of lipidomic analysis results showing the polyunsaturated phospholipid distribution among ES-2, OVCAR-8, OV56, and SKOV3 ovarian cancer cells. Red, high intensity; blue, low intensity. Three biological replicates were analyzed by lipidomics for each cell line. This experiment was performed once. SFA, MUFA, PUFA, saturated, monounsaturated, or polyunsaturated fatty acids.
C. Representative fluorescent images showing the I-max (0 sec) post the application of laser pulses to ES-2, OVCAR-8, OV56, and SKOV3 cells. Green, oxidized BODIPY-C11 signal; red, reduced BODIPY-C11 signal. Scale bar indicates 10 μm.
D. Scatter plots showing the oxidized/reduced BODIPY-C11 fluorescence of PALP signals in ES-2, OVCAR-8, OV56, and SKOV3 ovarian cancer cells. PALP signal was normalized by the reduced BODIPY-C11 fluorescence prior to laser stimulation. Dots and error bars, mean±s.d. Two-tailed unpaired T-test, **, p<0.01, ***, p<0.001. n=15. FC, fold-change.

