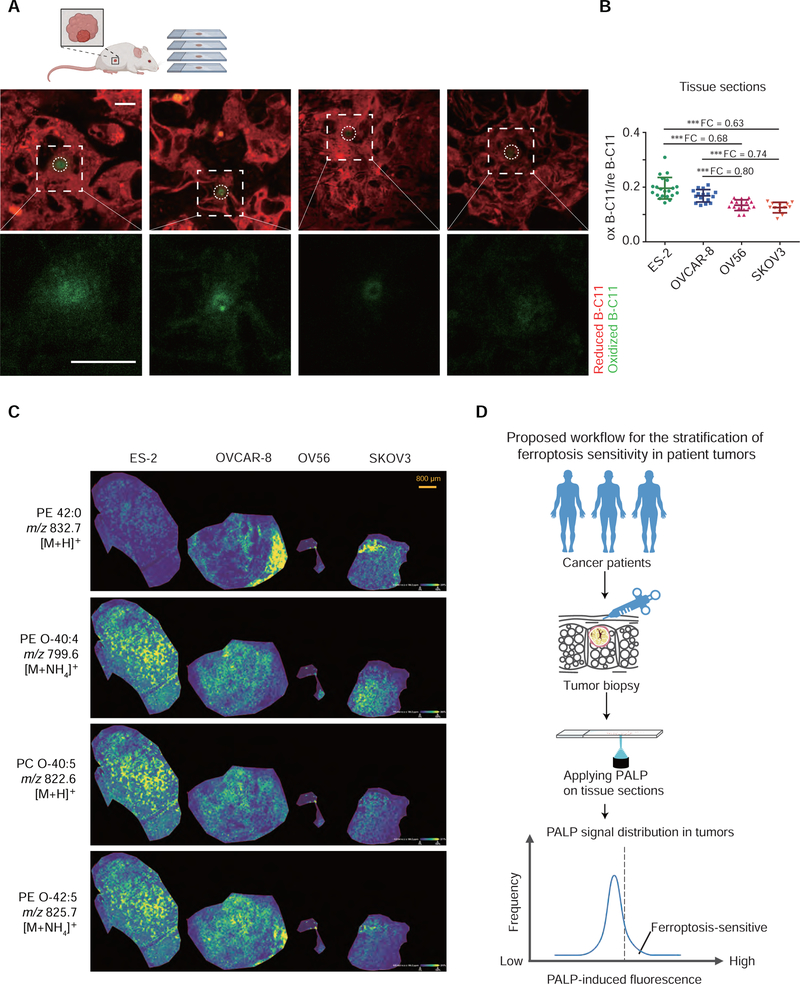
Figure 7. PALPv1-induced fluorescence is correlated with polyunsaturated phospholipid levels and ferroptosis in human ovarian xenograft tumors in vivo.
A. Representative fluorescent images showing the I-max (0 sec) post the application of laser pulses to xenograft tumor sections including human ovarian ES-2, OVCAR-8, OV56, and SKOV3 cells. Green, oxidized BODIPY-C11 signal; red, reduced BODIPY-C11 signal. Scale bar indicates 10 μm. The xenograft experiment was performed once. The scheme was created using Biorender (https://biorender.com/).
B. Scatter plots showing the oxidized/reduced BODIPY-C11 fluorescenceI of PALP signals in xenograft tumor sections including human ovarian ES-2, OVCAR-8, OV56, and SKOV3 cells. PALP signal was normalized by the reduced BODIPY-C11 fluorescence prior to laser stimulation. n=15. Dots and error bars, mean±s.d. Two-tailed unpaired T-test, ***, p<0.001. FC, fold-change. This experiment was performed once and x random regions were targeted and analyzed.
C. Mass spectrometry images showing the spatial distribution of representative phospholipid on xenograft tumor sections including human ovarian ES-2, OVCAR-8, OV56, and SKOV3 cells. Yellow, high intensity; Blue, low intensity. Scale bar indicates 800 μm.
D. Schematic diagram showing the proposed workflow for using PALP to stratify the ferroptosis sensitivity of patient tumors. We suggest collecting the tumor biopsy samples from cancer patients using fine needle aspiration, and then apply the PALP technique to cryo-sectioned tumor tissue samples. Relative sensitivity to ferroptosis of the tested tumor may be speculated based on the distribution of PALP signals relative to a validated reference dataset.

