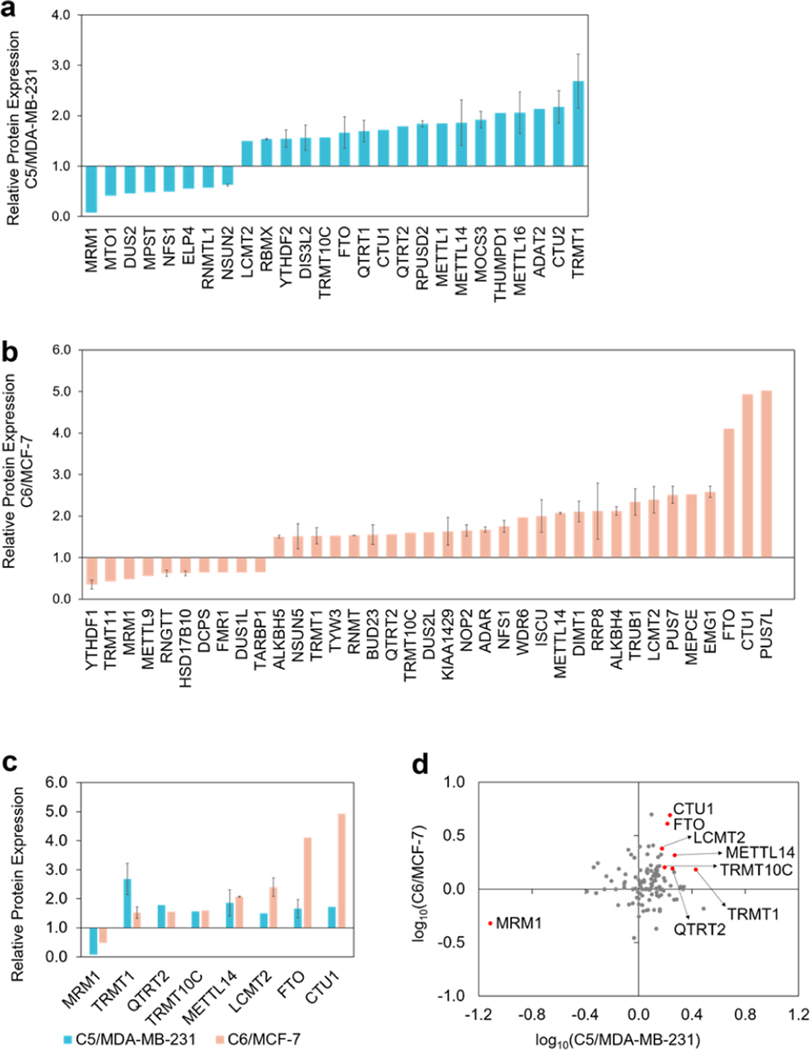
Figure 3.
(a,b) Bar graphs depicting the LC–PRM results for those epitranscriptomic RWE proteins with expression differences of over 1.5-fold or less than 0.67-fold in radioresistant cells relative to the corresponding parental cells. (c) Bar graphs illustrating epitranscriptomic RWE proteins that were commonly altered by over 1.5-fold in the two pairs of matched breast cancer cells. (d) Scatter plot displaying log10 transformed expression ratios of the quantified epitranscriptomic RWE proteins in the two pairs of matched breast cancer cells. Eight commonly altered RWE proteins from both pairs by over 1.5-fold were labeled in red dots. The data in parts a-c display the means and standard deviations of the quantified ratios of different peptides representing a specific epitranscriptomic RWE protein, where the ratio of each peptide was averaged from the quantification results of two forward and two reverse SILAC experiments. Error bars were displayed for those epitranscriptomic RWE proteins with more than one peptide being quantified.

