
Figure 3: Diabetic mice showed an increase in AGEs, and a decrease in bound water.
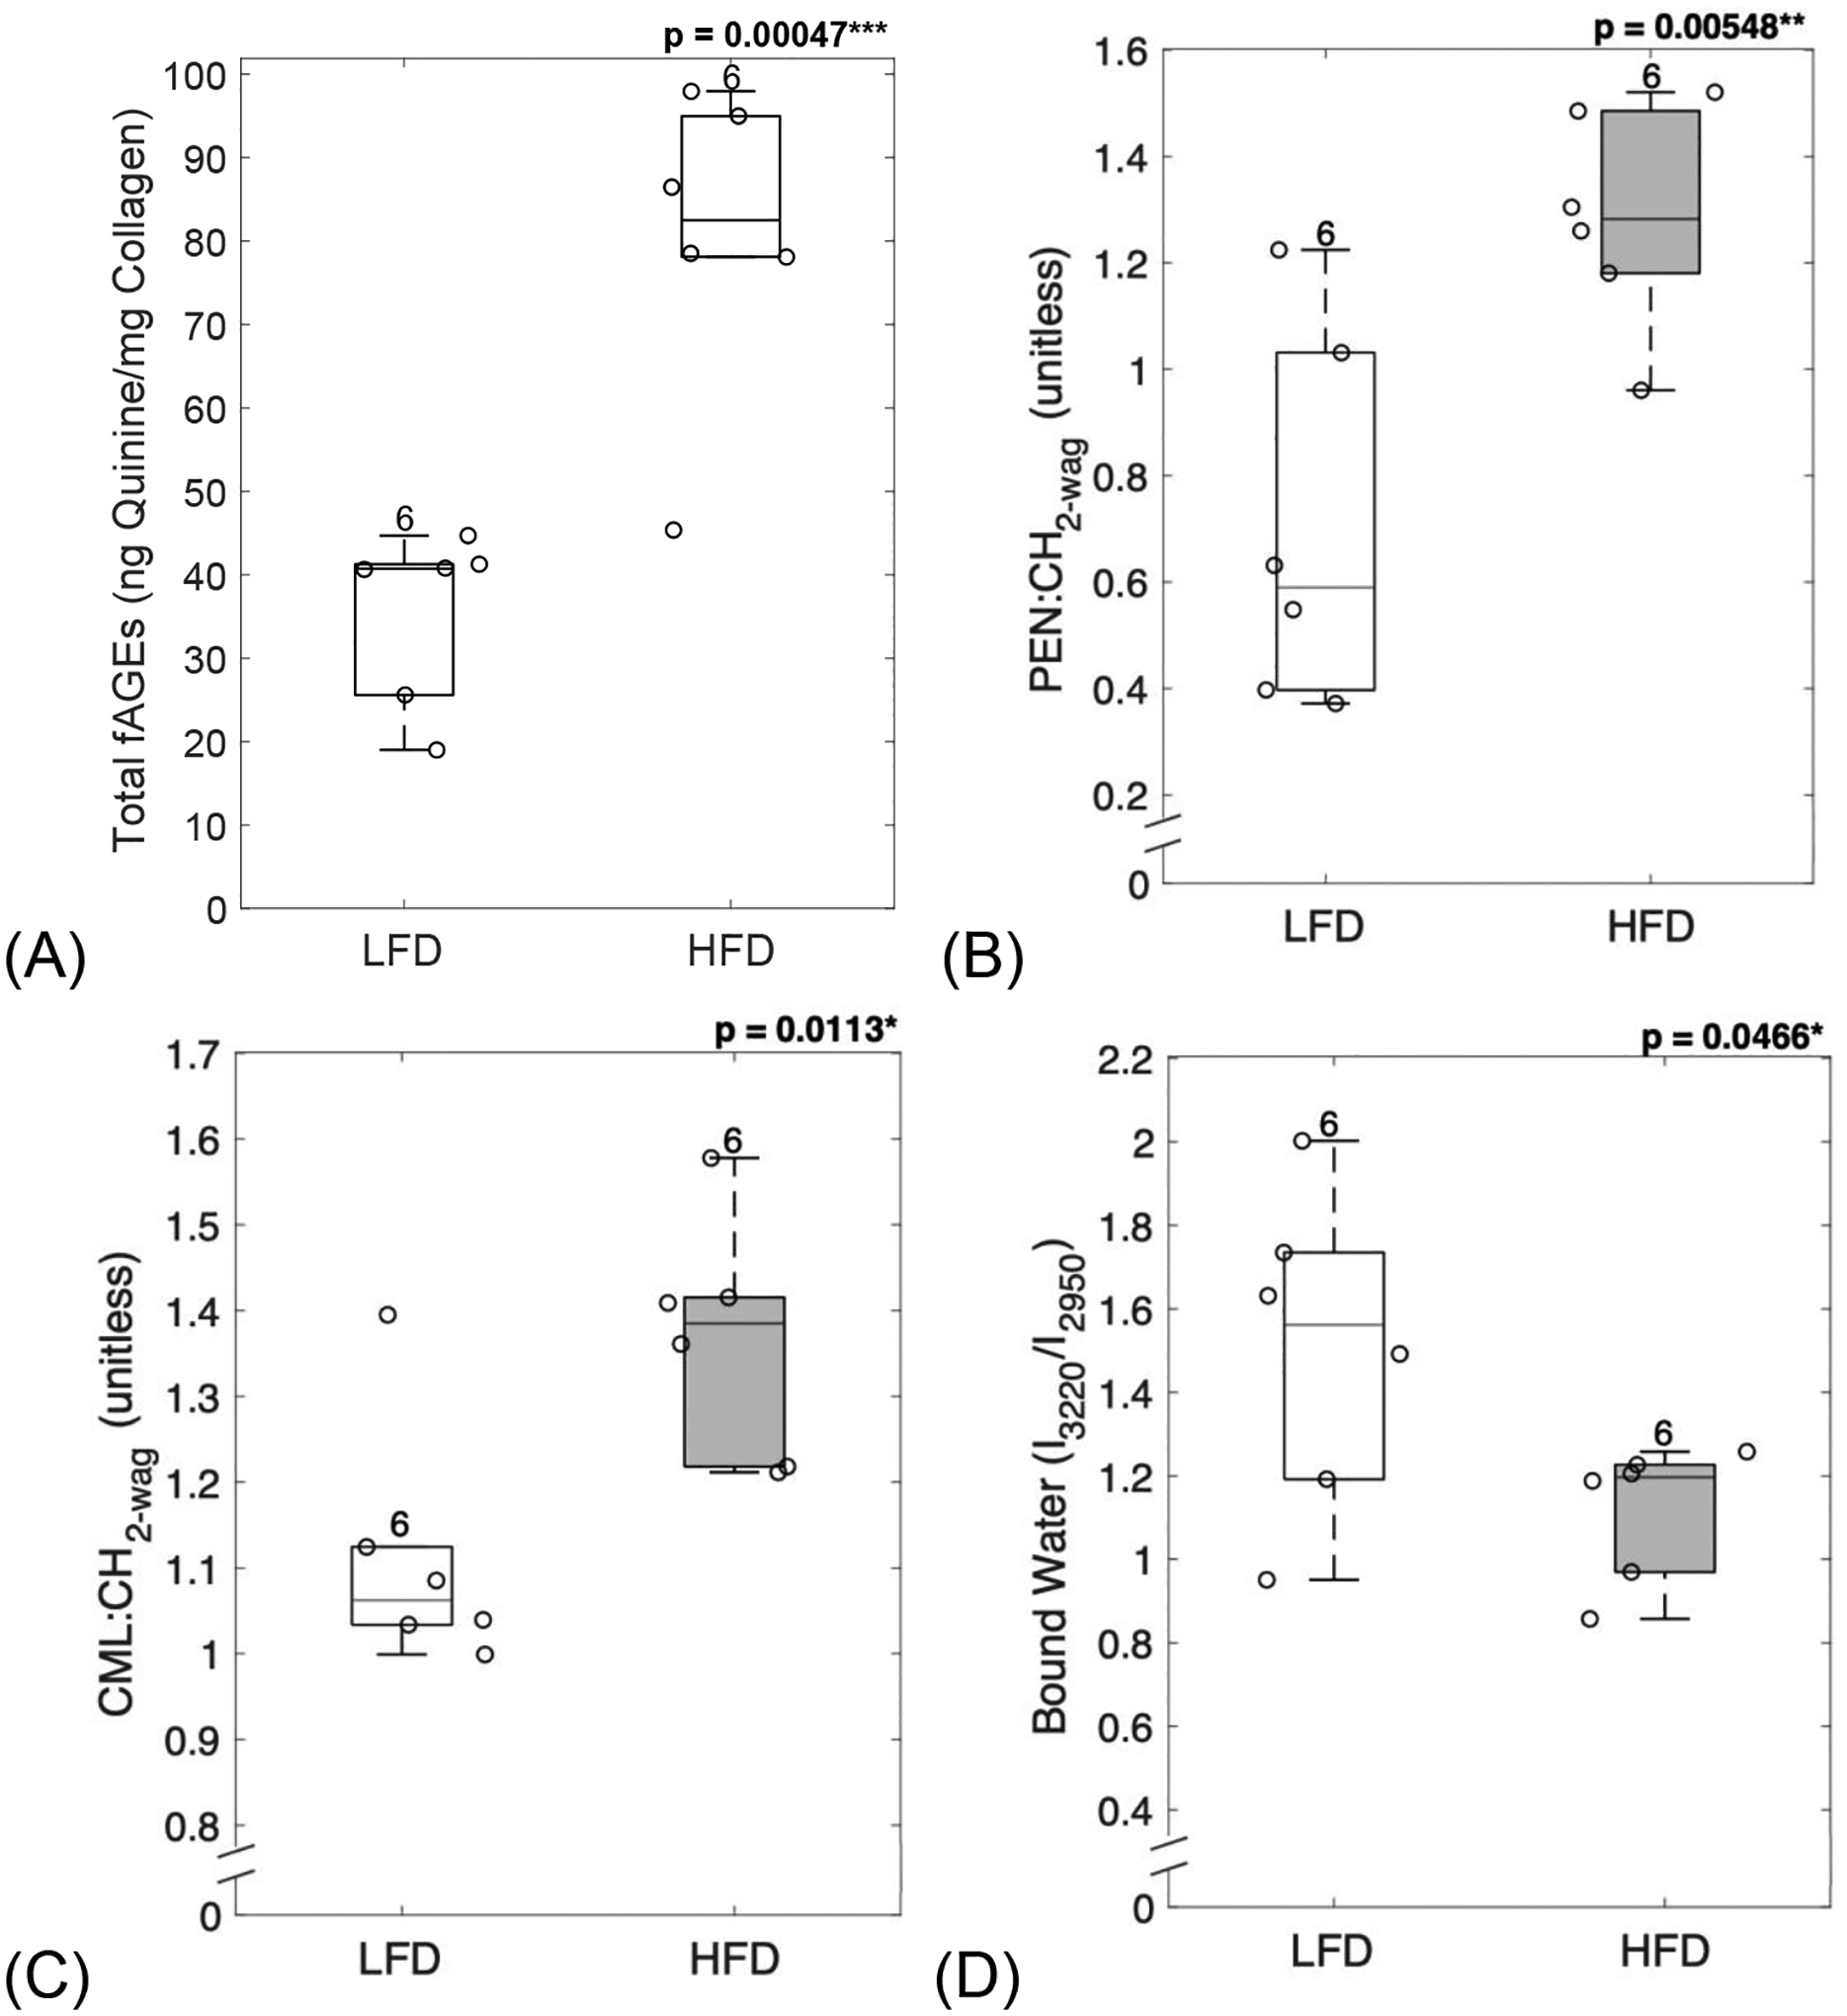
AGEs assay and confocal Raman spectroscopy were used to evaluate organic matrix properties from femoral cortical sections. Diabetic mice showed a significant increase in total fAGEs (A), pentosidine (B) and carboxymethyl-lysine (C), and a significant reduction in collagen bound water (D). LFD = low-fat diet; HFD = high-fat diet, fAGEs = fluorescent advanced glycation end-products. Results are shown as boxplots (with median and interquartile range) showing all data points. Statistically significant differences were determined by t-tests (unpaired, two-tailed, α=0.05). Number on top of each boxplot indicates sample size. Significant codes: p < 0.05 ‘*’, p < 0.01 ‘**’, p < 0.001 ‘***’.