
Figure 6: Loss of bone toughness in diabetic mice could be explained by mineral changes.
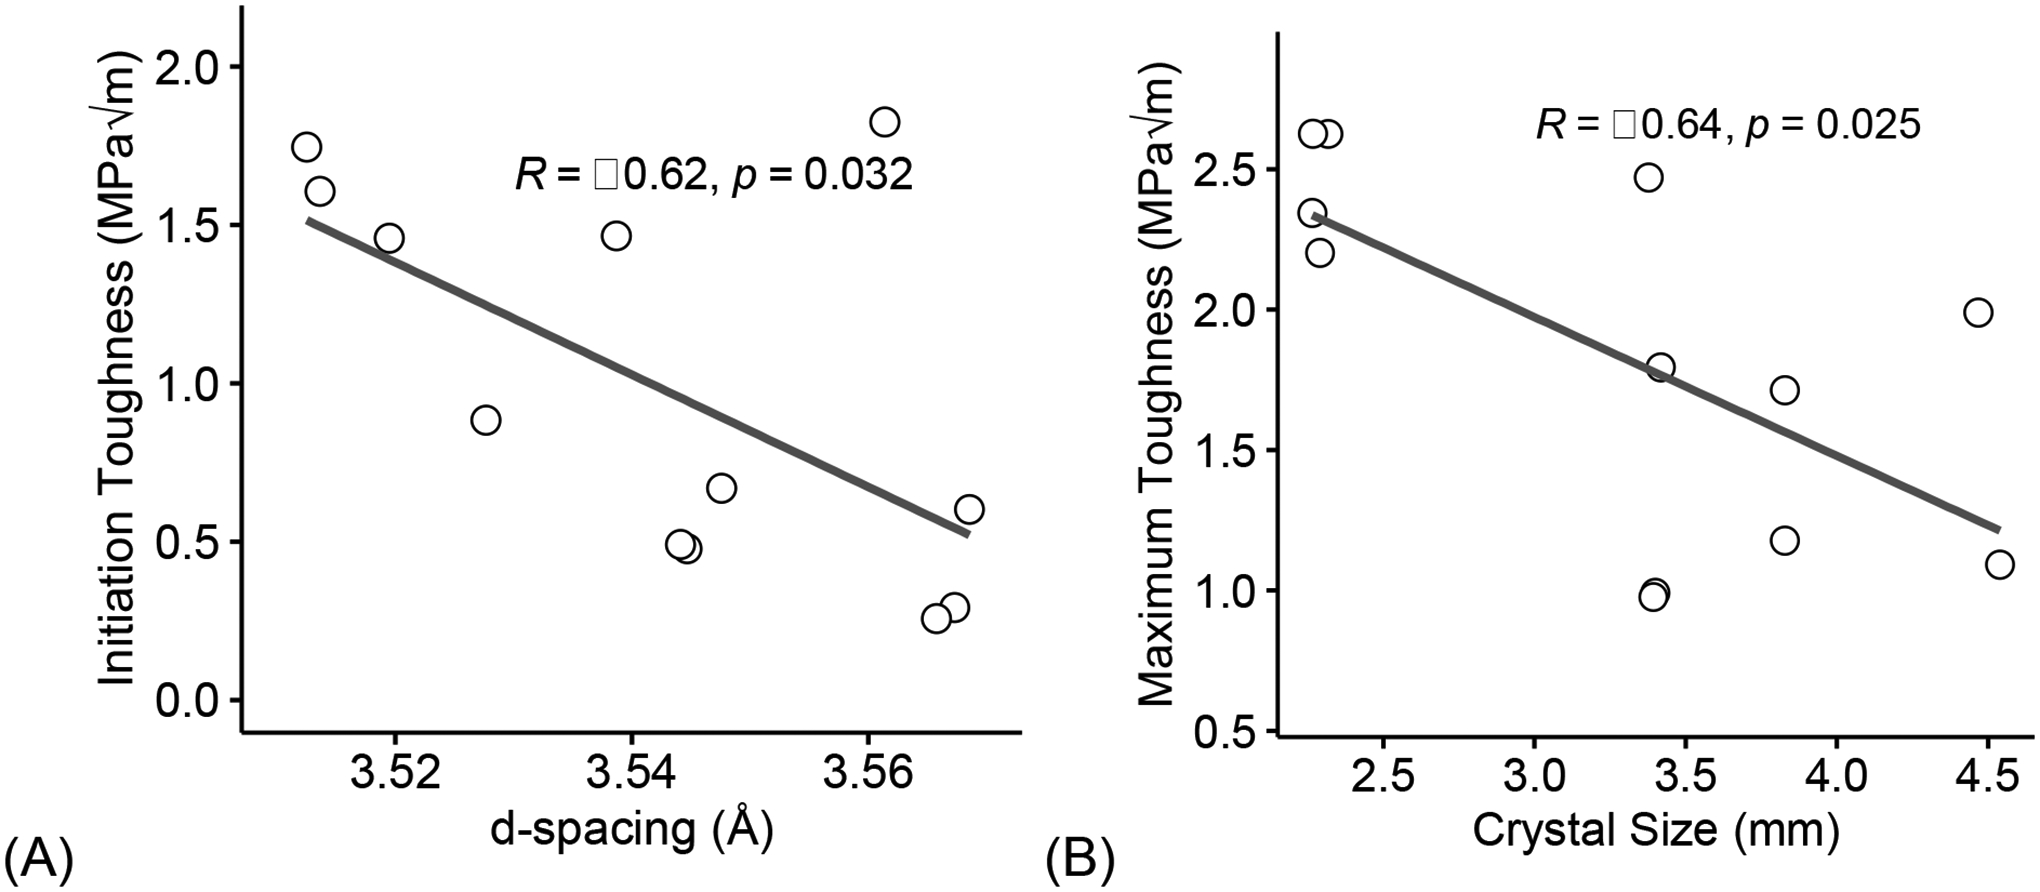
Increase in interfibrillar space, determined from XRD diffractions, correlated with a decrease in initiation toughness (A). Larger mineral crystal size negatively correlated with a loss of maximum toughness (B). Coefficient of correlation determined by Pearson’s R test (α=0.05). Significant codes: p < 0.05 ‘*’, p < 0.01 ‘**’, p < 0.001 ‘***’.