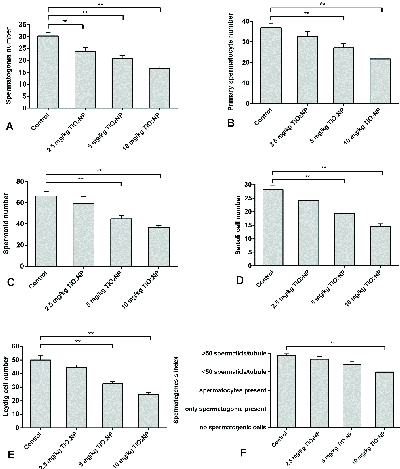
Figure 3.

Mean and standard error of cell number in seminiferous tubules in 2.5, 5 and 10 mg/kg groups in comparison with controls after 40 days of TiO NP exposure. A) Spermatogonia cell number, B) Primary spermatocyte cell number, C) Spermatid cell, D) Sertoli cell number, E) Leydig cell number, F) Spermatogenesis index. *P 0.05, **P 0.01.
