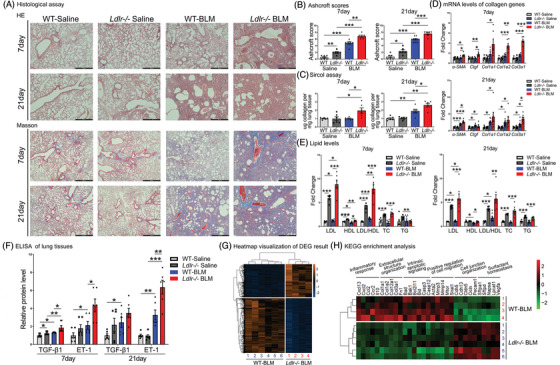
FIGURE 3.

Ldlr knockout exacerbated BLM‐induced PF. (A–C) Pulmonary tissue sections were stained with H&E and Masson's trichrome, and the Ashcroft score was calculated. Scale bar: 500 μm. (C) Soluble collagen synthesis in lung homogenate. (D) qRT‐PCR analysis of fibrosis‐related genes in mouse lungs. (E) Plasma lipid levels. (F) Measurement of TGF‐β1 and ET‐1 levels at day 7 and 21 after BLM treatment. (G) Heatmap of all of the differentially expressed genes in Ldlr−/− mice and WT mice in response to BLM administration. (H) The expression profiles of inflammation‐, ECM‐, apoptosis‐, migration‐, junction‐ and surfactant homeostasis‐related genes. mRNA levels, cell counts and lipid levels were normalized to the saline‐treated group. N = 6–10 per group in data (A) to (F) and N = 4–6 per group in data (G) and (H). *p < .05, **p < .01, ***p < .001 versus control. Data are presented as the mean ± SEM
