
FIGURE 6.
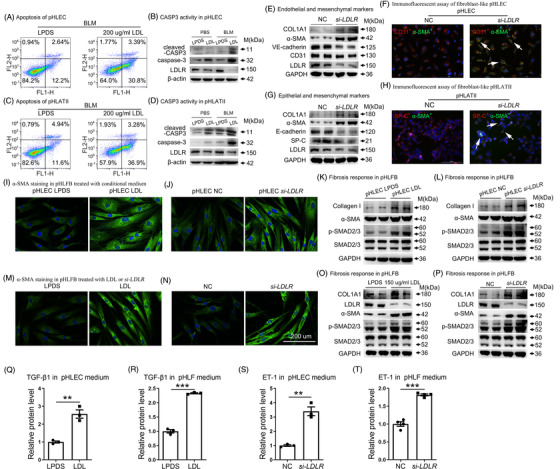
LDL and LDLR knockdown induced apoptosis, fibroblast‐like endothelial and ATII cells and fibrosis. Examination of apoptosis in pHLEC cells (A–B) and pHLATII cells (C–D) after LDL stimulation by flow cytometry and western blot. (E–F) Effects of si‐LDLR on the induction of fibroblast‐like endothelial cells based on western blot and immunofluorescent assay. (G–H) Effects of si‐LDLR on the induction of fibroblast‐like epithelial cells based on western blot and immunofluorescent assay. (I–J) Immunofluorescence of α‐SMA in PHLF after incubation with conditioned medium from LDL‐ or si‐LDLR‐treated endothelial cells. (K–L) Collagen, α‐SMA and p‐SMAD2/3 levels, as analyzed by western blot. (M–N) Immunofluorescence and western blot analyses were performed on cells treated with LDL or si‐LDLR for 12 and 48 h, respectively. (O–P) Collagen, α‐SMA and p‐SMAD2/3 levels, as analyzed by western blot. (Q–R) ELISA analysis of TGF‐β1 in culture medium from LDL‐treated pHLEC and PHFL cells, respectively. (S–T) ELISA analysis of ET‐1 levels in the culture medium from LDLR‐deficient pHLEC and PHFL cells. Lipoprotein deficient serum (LPDS) and control siRNA were used as controls. Scale bar: 200 μm. *p < .05, **p < .01, ***p < .001 versus control. Data are presented as the mean ± SEM of three independent experiments