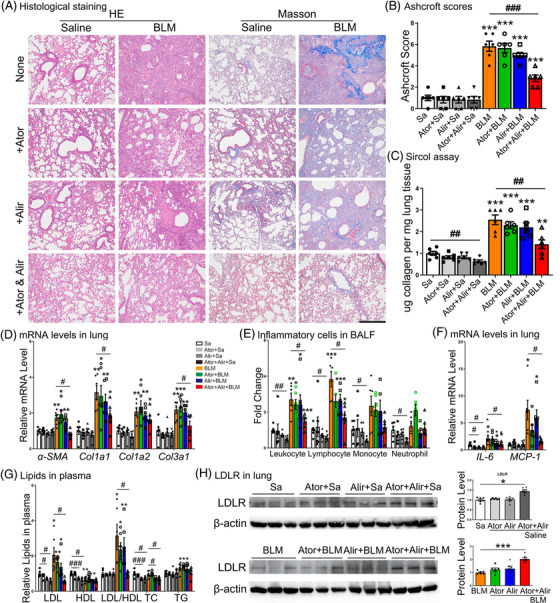
FIGURE 7.

Atorvastatin combined with alirocumab released BLM‐induced PF in vivo. (A–B) Lung tissue sections were stained with H&E and Masson's trichrome and the Ashcroft score was calculated. Scale bar: 500 μm. (C–D) Measurements of ECM content and the expression of collagen genes in lungs of mice receiving different treatments by Sircol assay and qRT‐PCR analysis, respectively. (E) Cell counts in BALF at baseline and 21 days after BLM treatment. (F) mRNA levels of IL‐6 and MCP‐1 in mouse lungs. (G) Plasma lipid levels. (H) LDLR expression in lungs of mice after treatment with atorvastatin, alirocumab or both in the saline group and the BLM group. N ≥ 6 per group. *p < .05, **p < .01, ***p < .001 versus saline control; #p < .05, ##p < .01, ###p < .001 within different treatment groups
