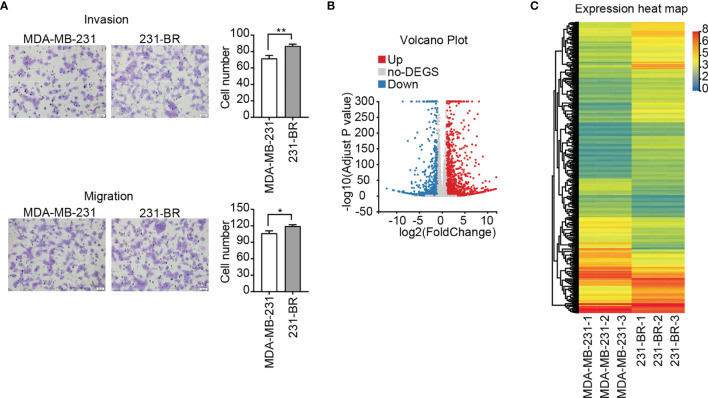
Figure 1.
Invasion, migration and gene expression of MDA-MB-231 and 231-BR cells. (A) Representative images of invasion and migration assays are shown on the left and quantified data on the right. Bar, 50μm. Student’s t-test was used for statistical analysis: *P < 0.05, **P < 0.01. (B) Volcano plot of DEGs. (C) The heatmap represents the expression values (FPKM) of DEGs.

