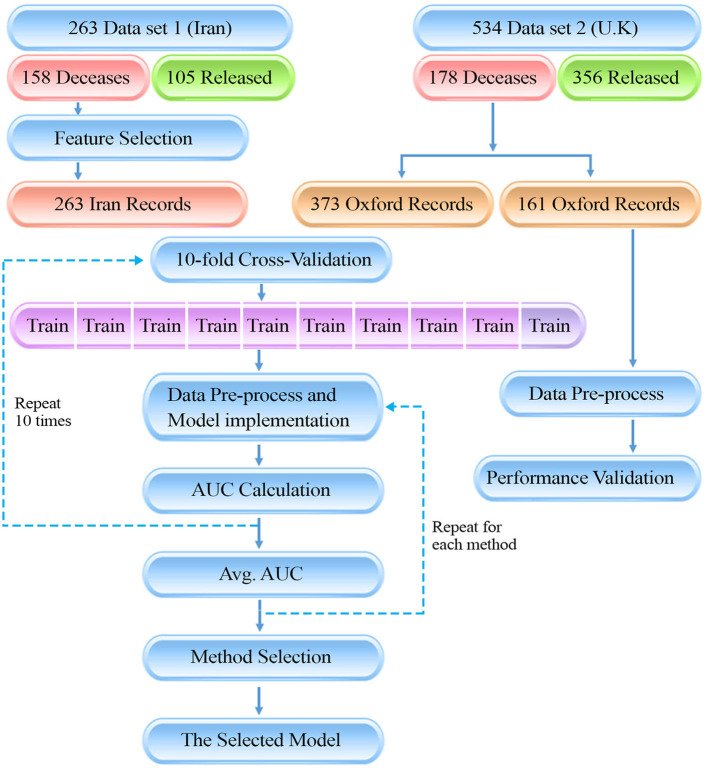
Graphical Abstract.
The presenting diagram, is showing the flow of our data gathering and method for the study. There are two data sources which ultimately have been used in a 10-fold cross-validation method to train the machine learning models. Finally, the model with the highest AUC was selected as final model.

