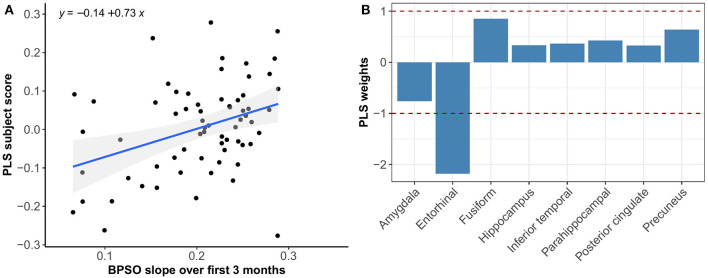
Figure 4.
Association between optimal spatial distribution of tau and BPSO slopes over 3 months in the Aβ− group. Left panel (A) shows the correlation between PLS subject scores (expression of spatial patterns of tau distribution) and BPSO slopes; right panel (B) presents the spatial patterns of tau distribution of z-transformed PLS weights in each ROI.

