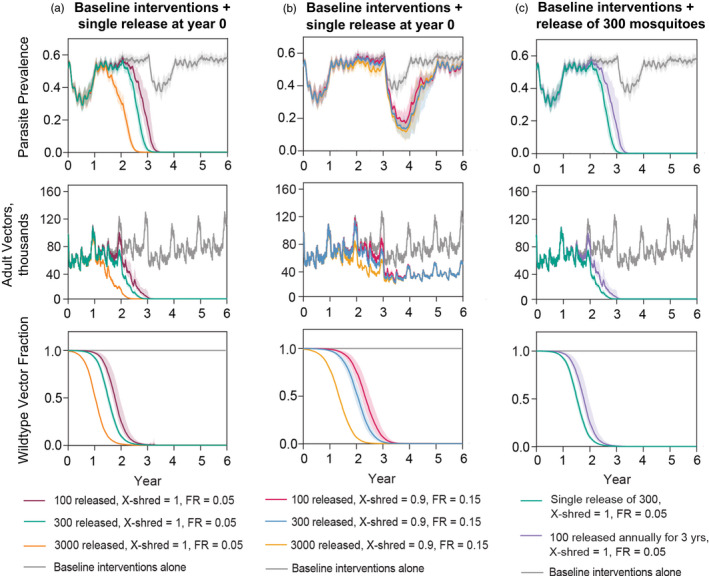
FIGURE 2.

Selecting frequency and size of gene drive release in a nonspatial model in the presence of baseline ITN and ACT use. Single releases occurred at Year 0 and multiple releases were at year 0, 1, and 2. Shaded areas indicate 95% predicted intervals from 25 stochastic realizations. (a) Single release of a highly efficient drive. (b) Single release of a less efficient drive. (c) Single and multiple releases of a highly efficient drive. Results for the Equateur site are shown. Results for other sites are in Supporting information S2.3
