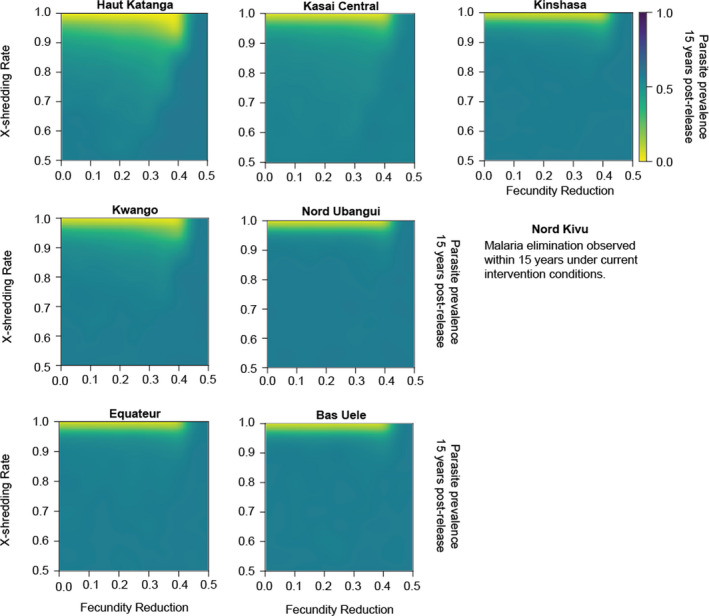
FIGURE 3.

Dependence of final parasite prevalence on X‐shredder efficiency and fecundity reduction for the eight modeled sites in the nonspatial framework. Simulation outputs are means of 10 stochastic realizations per parameter combination and are observed 15 years after the release of 300 gene drive mosquitoes. See Supporting information 3 for upper and lower 95% predicted interval bounds and for outcomes with 100 or 200 mosquitoes released
