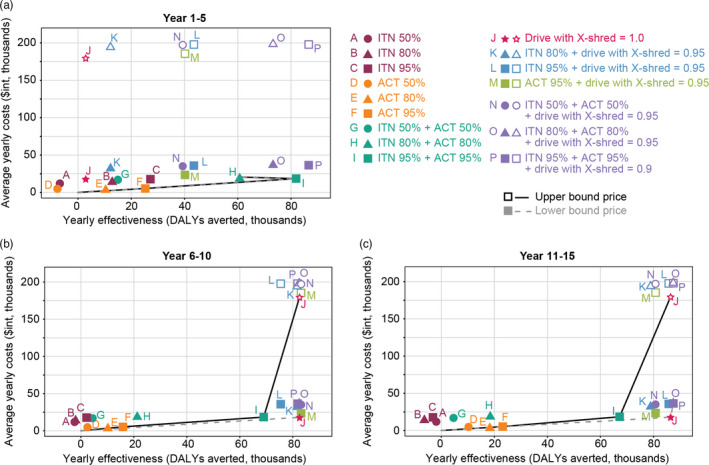
FIGURE 4.

Cost‐effectiveness plane showing 16 intervention packages (10 individual and combination interventions at three assumed coverage levels) and expansion paths for Year 1–5, Year 6–10, and Year 11–15. The dashed lines (filled symbols) are expansion paths based on the lower bound, and the solid lines (empty symbols) are expansion paths based on the upper bound costs of gene drives
