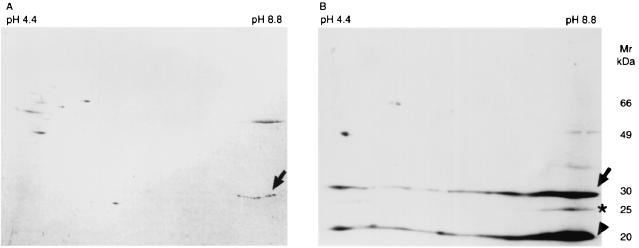
FIG. 3.
(A) Protein spots of whole-cell sonicate of H. pylori ATCC 43504. Proteins were separated by two-dimensional GE: isoelectric focusing in the first dimension and SDS-PAGE in the second dimension. Proteins were transferred to PVDF membrane and then stained with Coomassie brilliant blue R-250. (B) Western blot result of the same preparation with serum from a gerbil taken 5 weeks after H. pylori inoculation. Serum was diluted 1:100. The pH is indicated at the top of the figure and molecular masses in kilodaltons are indicated on the right-hand side. Arrow, asterisk, and arrowhead indicate 30-, 25-, and 20-kDa proteins, respectively.

