
TABLE 4.
Causal manipulations of oscillations or synchrony and effect on neural measurements.
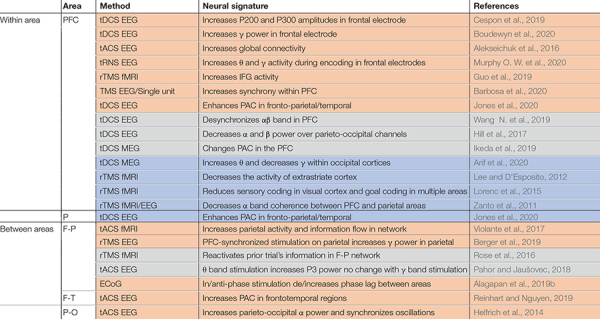
|
Studies are grouped according to whether they include one or multiple areas, then by the area(s) being manipulated (Area). The method of manipulation and measuring brain activity is specified (Method), along with the effect on neural activity (Neural Signature), and relevant citations (References). Color coding reflects behavioral effect, as in Table 3: for rows in orange stimulation improved performance or RT, gray showed no effect, blue indicates a detrimental effect on performance or RT. IFG, inferior frontal gyrus; P-T, parieto-temporal.