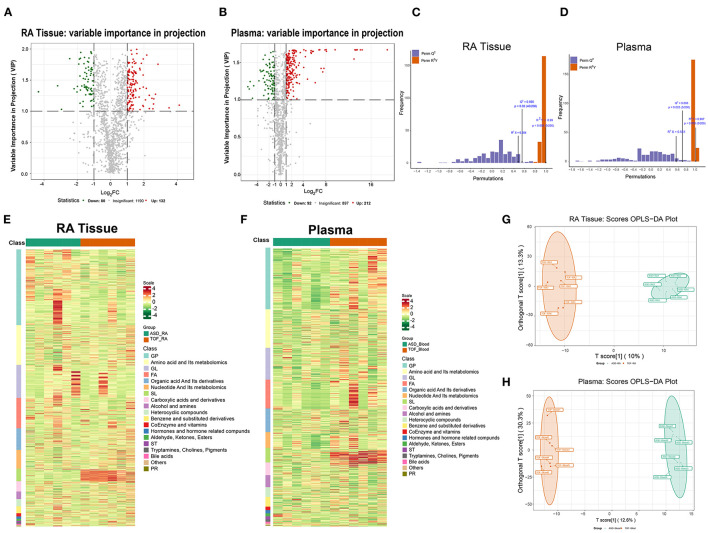
Figure 4.
Statistical analysis of differential metabolites between the TOF and ASD samples. (A,B) Volcano plot showing the differential metabolites between the TOF and ASD samples. Red and green indicate upregulated and downregulated metabolites in the TOF group, respectively. (C,D) OPLS-DA score plot. The X-axis represents the predicted component score, while the Y-axis represents the orthogonal component score. (E,F) Heatmap showing the differential metabolites of the right atrium (RA) and plasma between patients with TOF and ASD. (G,H) Plot of the RA and plasma OPLS-DA between patients with TOF and ASD.

