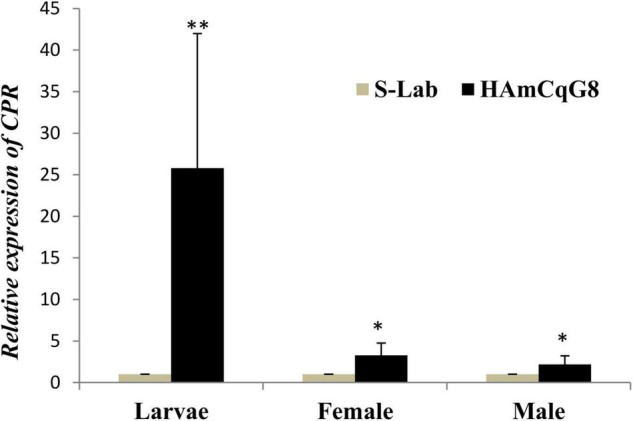
FIGURE 5.

Cytochrome P450 reductase (CPR) relative gene expression in HAmCqG8 strain compared to the S-Lab strain. The relative levels of gene expression shown along the Y-axis represent the ratio of the gene expression in each sample of the resistant HAmCqG8 strain compared to that of the S-Lab strain. The results are shown as the mean ± S.E. A student’s t-test was used for the statistical significance analysis. Only both a value of P ≤ 0.05 and a cut-off value of a ≥2-fold change in expression (Strode et al., 2008) was considered as a statistically significant overexpression. *P ≤ 0.05, **P ≤ 0.01.
