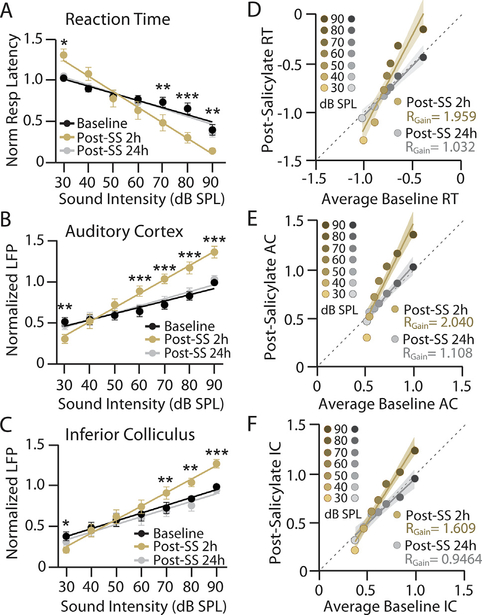
Fig. 2.
Salicylate induces time-dependent parallel changes to reaction time, cortical, and subcortical response-intensity functions in a manner consistent with temporary hearing loss, increased loudness perception and central gain enhancement. A-C: Mean (n = 8) (A) RT-I functions, (B) AC LFP I/O functions, and (C) IC LFP I/O functions from behaviorally trained rats with chronically implanted electrodes before and after sodium salicylate (SS) administration (200 mg.kg, i. p.); data shown before (black), 2 h post-SS (orange), and 24 h post-SS (gray). Baseline (black) represents average response across three baseline sessions. For ease of comparison, all responses were normalized to maximum average baseline response to account for between-subject differences in absolute RTs and AC/IC response size. Data points represent mean +/−SEM. Lines represent linear fit of RT, AC, and IC response functions, which were used to determine changes in response slope (see Table 1). Two-way repeated measure ANOVAs found significant main effects of SS treatment and sound intensity, as well as an interaction between the two, for RT (SS: F2,98 = 8.84, **p = 0.0003, ; Intensity: F6,98 = 28.82, ***p < 0.0001, ; interaction: F12,98 = 6.14, ***p < 0.0001, ), AC responses (SS: F2,98 = 35.64, ***p < 0.0001, ; Intensity: F6,98 = 22.03, ***p < 0.0001, ; interaction: F12,98 = 8.90, ***p < 0.0001, ) and IC responses (SS F2,98 = 25.18, ***p < 0.0001, ; Intensity: F6,98 = 17.83, ***p < 0.0001, ; interaction F12,98 = 4.67, ***p < 0.0001, 0.46). Post-hoc significance for intensity-dependent effects of SS at 2 h compared to baseline signified as: *p < 0.05, **p < 0.01, ***p < 0.0001. No significant effects of were found between baseline and 24 h post-SS. D-F: Scatter plots comparing the average normalized baseline response at each intensity against the normalized response 2 h post-SS (orange-brown) or 24 h post-SS (gray-black) of equivalent intensity for (D) RT, (E) AC LFP, and (F) IC LFP responses. The slope of the linear fit (RGain) provides an estimate of the change in response gain across conditions where RGain = 1 indicates a response growth rate matched to baseline levels while RGain > 1 and RGain < 1 indicate a multiplicative enhancement or divisive decrease in response growth rate compared to baseline, respectively. Shading represents 95% confidence interval of linear fit. A two-tailed F-test determined that RGain was significantly different from 1 at 2 h post-SS for RT-I, AC, and IC LFP functions (RT: RGain = 1.959, F(1,54) = 21.89, ***p < 0.0001, d = 3.31; AC: RGain = 2.040, F(1,54) = 31.84, ***p < 0.0001, d = 3.99; IC: RGain = 1.609, F(1,54) = 26.19, ***p < 0.0001, d = 3.62). A 24 h post-SS, no response gain significantly deviated from 1 (RT: RGain = 1.032, F(1,54) = 0.070, p = 0.792, d = 0.187; AC: RGain = 1.108, F(1,54) = 0.596, p = 0.444, d = 0.546; IC: RGain = 0.9464, F(1,54) = 0.190, p = 0.665, d = 0.308).

