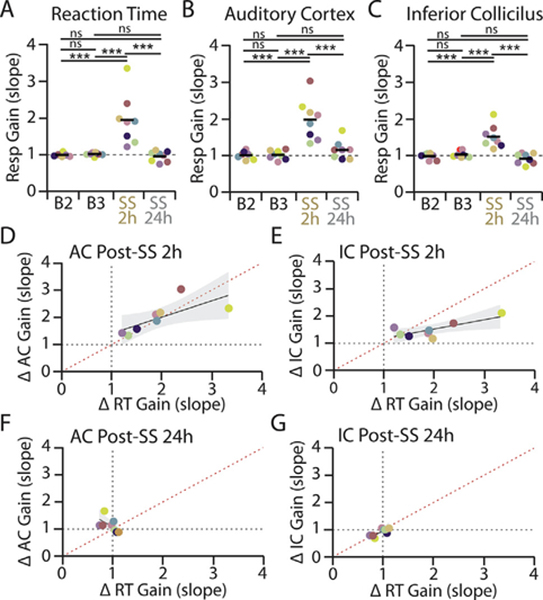
Fig. 4.
Salicylate-induced changes to reaction time and evoked response-intensity functions co-vary within individual animals. A-C: Response gain (RGain), as quantified in Fig. 2D–F, was determined for each animal (n = 8) over the final two baseline testing sessions (B2, B3), 2 h post-SS and 24 h post-SS for (A) RT, (B) AC, and (C) IC response functions. Each color corresponds to an individual animal. One-way repeated measures ANOVAs found a significant effect of SS treatment on RT (F(3,28) = 14.44, ***p < 0.0001, ƞ2 = 0.67), AC LFP (F(3,28) = 19.25, ***p < 0.0001, ƞ2 = 0.73) and IC LFP (F(3,28) = 15.20, ***p < 0.0001, ƞ2 = 0.68) response gains. Post-hoc significance ***p < 0.0001. There was also a significant increase in the variance of response gains following SS administration (RT: Bartlett’s statistic for equal variance = 58.7, *** p < 0.0001; AC: Bartlett’s statistic = 22.97, ***p < 0.0001; IC: Bartlett’s statistic = 15.62, **p = 0.0014). D-G: Relationship between changes to RT-I and evoked response following salicylate administrations. Correlation between the fold change in RT gain (RGain) versus (D) AC response gain or (E) IC response gain at 2 h post-SS. F-G: Correlation between the fold change in RT gain and (F) AC response gain or (G) IC response gain at 24 h post-SS. Each color corresponds to an individual animal as in panels A-C. Shading represents 95% confidence intervals of linear fit (black). Red dotted line corresponds to 45° unity line.

