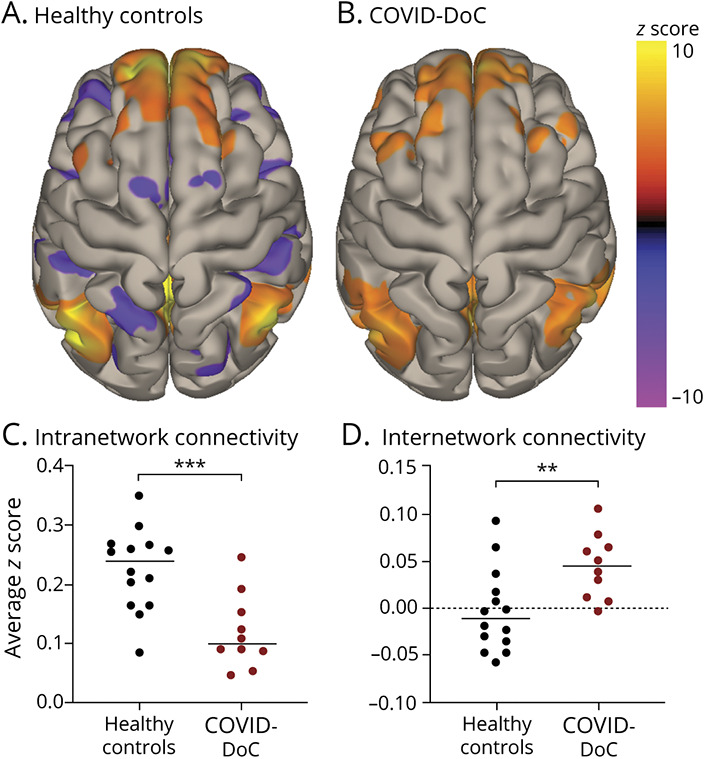
Figure 3. Resting-State Functional Connectivity for Patients With COVID-DoC and Healthy Controls.

Connectivity of the default mode network is depicted as group-wise seed-to-voxel maps, generated with seeds at 4 nodes—the medial prefrontal cortex, posterior cingulate cortex, and bilateral inferior parietal lobules—for healthy controls (A) and patients with disorders of consciousness in coronavirus disease 2019 (COVID-DoC; B). Warmer colors represent positive correlations (reflecting intranetwork connectivity); cooler colors represent negative correlations (reflecting internetwork connectivity). Patients with COVID-DoC demonstrated less positive intranetwork connectivity (C) and less negative internetwork connectivity (D) than healthy controls. **p < 0.01. ***p < 0.001.
