Figure 1.

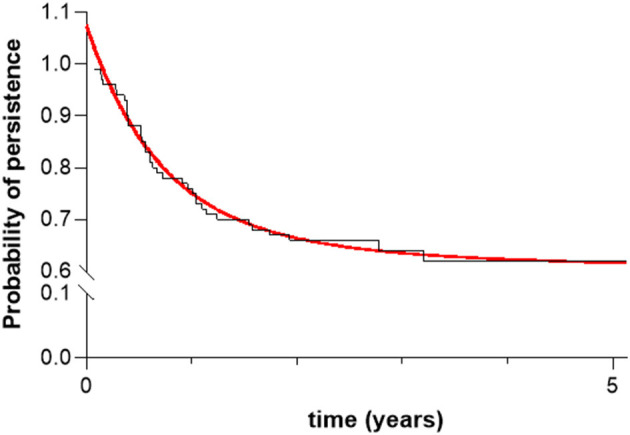
Survival curve of secukinumab in the entire population. Red line represents the fit of the Kaplan-Meier survival curve to the exponential two-phase decay equation model (R2 = 0.98).

Survival curve of secukinumab in the entire population. Red line represents the fit of the Kaplan-Meier survival curve to the exponential two-phase decay equation model (R2 = 0.98).