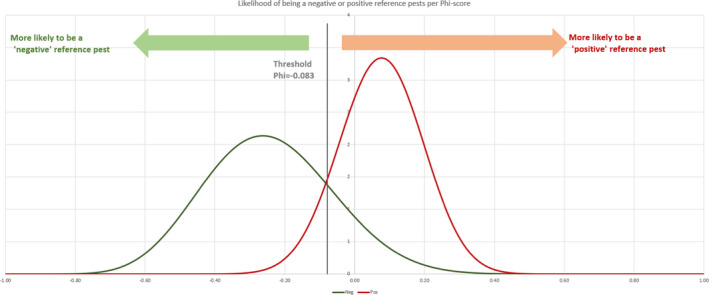
Figure 20.

Distribution of the overall Phi‐scores for negative (green) and positive pest (red) as density functions estimated from the reference data set. The decision rule uses the density values to assess, which classification is more likely for the different general score values (on the horizontal axis)
