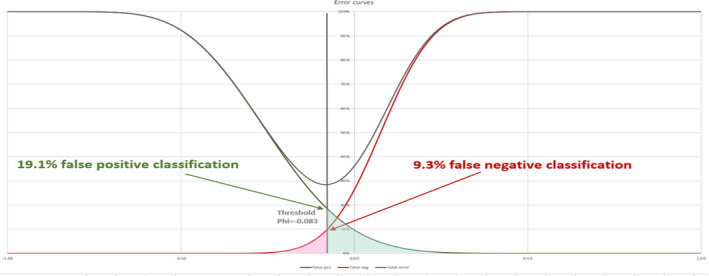
Figure 21.

Distribution functions of the overall Phi‐scores for negative (descending, green) and positive pest (ascending, red) estimated from the reference data set. The grey curve is the sum of both distribution functions indicating the total misclassification error. The decision rule (vertical line) minimises the total error. The crossings with the individual curves are the false‐positive and false‐negative classification rate
