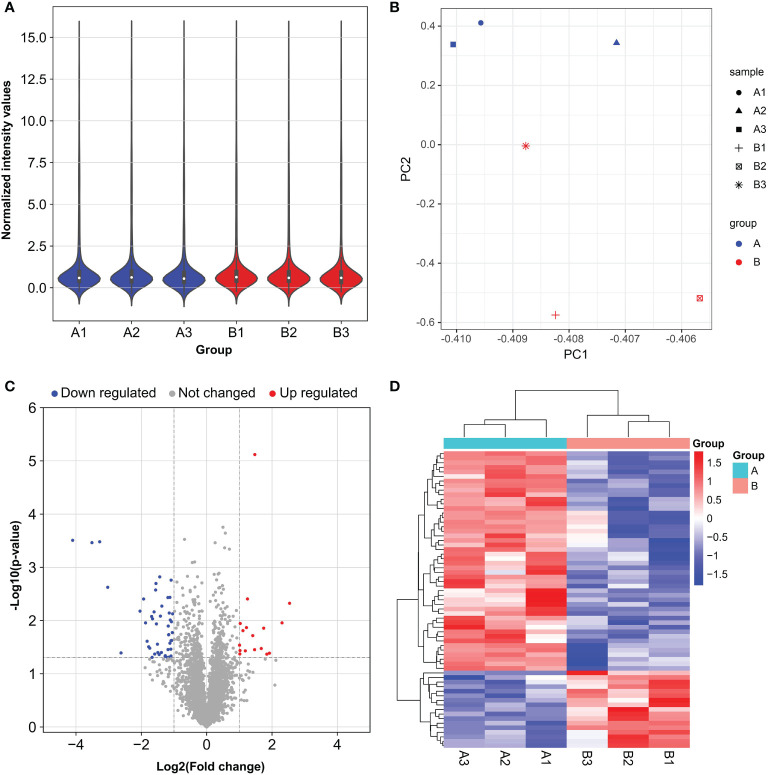
Figure 4.
Distinct microRNA (miRNA) expression profiles in A549 cells after LINC00467 knockdown. Group A (A1, A2, A3): control cells; Group B (B1, B2, B3): LINC00467 knockdown cells. (A) Violin plots showing the normalized intensity values for miRNA microarray datasets. (B) Principal component analysis of the miRNA microarray datasets. (C) Volcano plot of miRNA expression. MiRNAs with p-value < 0.05 and |fold change| ≤ 2 were determined as differentially expressed. Up regulated (red) and down regulated (blue) miRNA with twofold change are shown. (D) Heat map and hierarchical clustering of the differentially expressed miRNAs. The left vertical axis presents the clusters. The horizontal axis represents the sample groups (control cells in aqua: A1–A3 and LINC00467 knockdown cells in red: B1–B3). Red indicates high relative expression and blue indicates low relative expression.

